Why a 10-K Breaks a PDF Parser,
and What to Keep
A 10-K holds four or five statements, a notes section that can run for sixty pages, and a management discussion laid out in whatever column format the typesetter chose. The digits are the easy part. What makes the filing hard to read by machine is that each figure means something only in relation to three things that are not figures: the statement it sits in, the period column above it, and the unit declared once at the top of the grid.
A general PDF parser treats a page as a stream of text and a table as a rectangle of cells. A 10-K is neither of those things, and the gap shows up later as a spreadsheet that looks complete and reconciles to nothing.
Key Takeaways
- A PDF parser can read every digit on a 10-K correctly and still return a figure that is off by a factor of 1,000.
- That error hides in a caption printed once above the grid, so the cell itself looks perfectly ordinary.
- Four columns that name the statement, period, unit and page make every row checkable in seconds.
The audience for this article is the person holding the PDF, not the person building a retrieval pipeline. Equity analysts pull peer statements into a comparison sheet, financial data teams feed a warehouse, auditors sample disclosed figures. In all three cases the document arrived from an investor relations page, a client email, or a filing agent, and it is a rendered copy of something that exists in another format on EDGAR, the SEC's filing system. What follows is where that copy loses structure, and what an extraction has to carry out of it to be worth keeping.
A 10-K Is a Filing With Several Statements, Not One Table
The first decision a 10-K extraction has to make is which statement a row belongs to, and a generic PDF parser never asks the question. A Form 10-K runs through four parts and a list of items. Item 8 holds the audited financial statements and the notes, Item 7 holds management's discussion, Item 1A holds risk factors. Even inside Item 8 there are four or five statements, each with its own title, its own unit line and its own set of totals, depending on whether comprehensive income is presented separately or inside the income statement.
That matters because "Total" is not a label that identifies anything on its own. Every statement has a total row, and several of them use the same words: total assets, total liabilities, total equity, total revenues. Read a total without knowing which statement produced it and you cannot say what it should equal, what it should be compared to, or whether it belongs in the balance sheet block of your workbook or the cash flow block. A parser that returns reading order returns the labels correctly and the meaning not at all.
There is a second reason the statement boundary matters. The unit declaration is printed once above each grid, so the balance sheet can be in thousands while a note three pages later is in millions. The statement is the scope of the unit, which makes it the scope of the arithmetic. Get the boundary wrong and the multiplier is applied across two different scopes.
One fact about the file itself is worth settling early. The copy the SEC publishes is HTML with inline XBRL embedded, meaning the financial numbers are tagged in a machine-readable taxonomy inside the page itself, and the PDF most people work from is a rendering posted by the company or a scan of a printed annual report. So the job of 10-K parsing here is to recover the structure of a visual copy, and SEC filing extraction is mostly a layout problem before it is a character-recognition problem.
That layout is not stable between companies, which is where most of the difficulty actually lives. Practitioners describe it without much patience: "Table extraction from SEC filings is genuinely annoying because the formatting varies wildly across companies and even across years." (r/fintech). A rule that works for one filer's balance sheet has to be rewritten for the next one, and again when the same company changes auditors or adopts a new standard.
Two Statements Can Share a Page, With the Second Starting Below the First One's Last Row
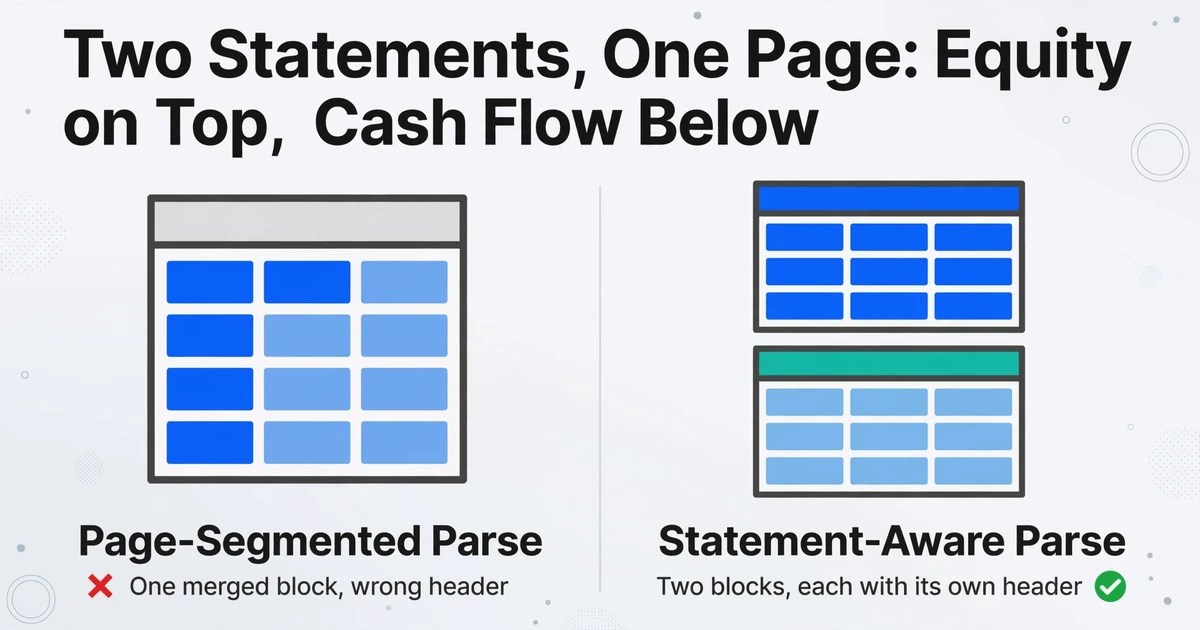
Filing typesetters do not give every statement a fresh page. To keep the document from growing, the last rows of the statement of changes in equity often sit at the top of a page and the consolidated statement of cash flows begins immediately underneath, with its own title and its own header row.
A parser that segments by page returns one block. The block is internally ordered the way a reader would see it, so nothing looks broken: the equity rows are on top, the cash flow rows below, and every number is in the right place on the page. The damage is in the table. Rows from two statements now share one header, and the header belongs to whichever statement the parser attached. Equity columns like accumulated other comprehensive income end up over cash flow figures, and the cash flow subtotal inherits a column it was never meant to sit under.
The failure leaves the row count roughly right, which is why it survives a first look and fails at the first reconciliation.
The downstream symptom is specific. Operating cash flow should start from net income and end at the change in cash, and the statement prints both ends. When the block is merged, the check either cannot run or fails on a row that is actually in the wrong table. The analyst sees a reconciliation break and starts hunting a misread digit, when the digit is correct and the row is in the wrong statement.
A Table That Crosses a Page Break Loses Its Header, Not Its Numbers
A balance sheet that starts near the bottom of page 58 continues on page 59, and the continuation page may repeat the statement title, sometimes with "(continued)", while the column headings are frequently missing. The numbers keep coming; the periods above them do not.
Parse each page independently and you get two tables. The first has a header and half the rows. The second has the remaining rows and no period assignment at all. A parser trying to be helpful will take the nearest header on the continuation page, which may belong to an entirely different table that begins lower down, and the rows are then labeled with the wrong years. Either way the figures are read correctly and filed under the wrong column.
Cross-page structure is the normal case, not an edge case. In FinMMDocR, a benchmark of 1,200 expert-built financial questions over 837 documents averaging 50.8 pages, 65% of the questions require evidence that spans more than one page, with an average of 2.4 evidence pages each. The same study's error analysis is more telling for anyone who blames arithmetic: 78 of 100 sampled failures were document-understanding failures, meaning the model could not locate or read the evidence, while only 5 were calculation errors (Tang et al., FinMMDocR, AAAI 2026).
The practical consequence is that a page-level extraction cannot run the statement's own checks. Assets equal liabilities plus equity only if all the asset rows and all the liability rows survived with their periods attached. Half a table cannot be checked against itself, which is how an unlabeled continuation page turns into a spreadsheet that no one can validate.
The Period Lives in a Merged Header Cell, and Merged Cells Are the First Thing a Parser Flattens
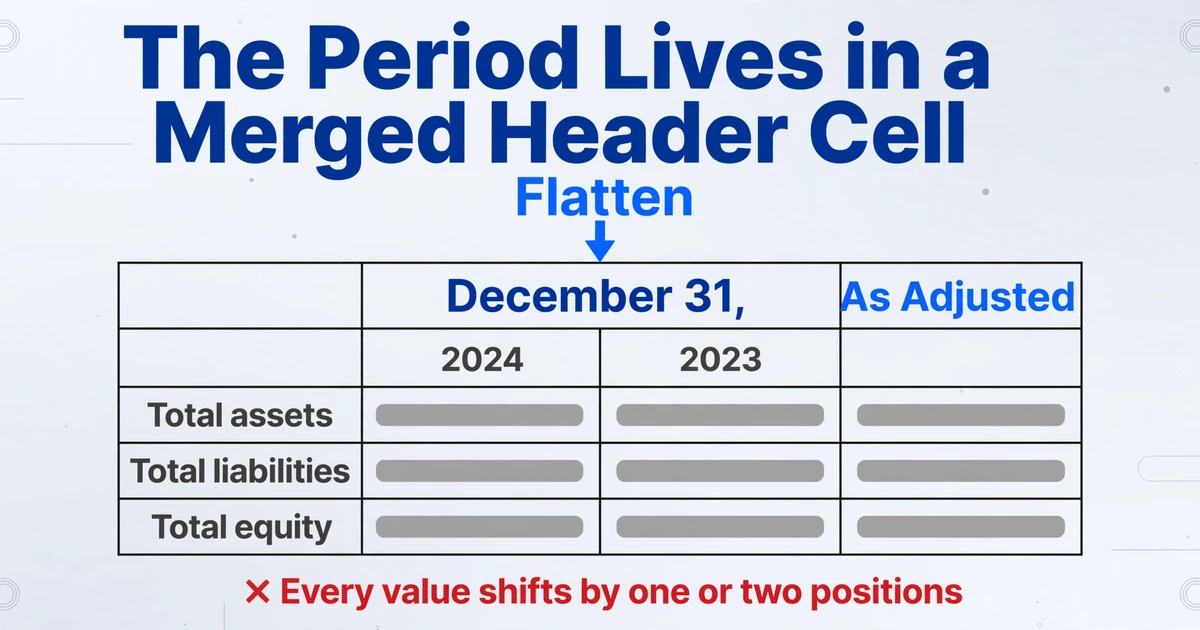
A 10-K header is rarely a single row of year labels. It is a hierarchy. "December 31," spans two columns, with "2024" and "2023" underneath it. A third column carries "As Adjusted". After a merger or a fiscal year change, the header splits into "Successor" and "Predecessor" blocks separated by a rule, and the periods on either side are not the same length, so one column may cover eleven months and the next twelve.
Flattening that hierarchy is where column assignments go wrong, and the "As Adjusted" column shows why it is worse than a missing label. Both columns can carry the year 2024. One is the figure as reported, the other is the figure restated on a pro forma basis for an acquisition. Drop the subheader and you have two columns with the same name, no way to tell which is which, and a comparison sheet that silently mixes a reported number with an adjusted one.
A merged cell creates a second kind of error. When one header cell spans three columns and the parser collapses it into the first column, every value beneath it shifts left by two positions. The digits are right, the row labels are right, and the year is wrong. Nothing in the cell flags it, because a wrong column is still a valid number.
A merged header cell is a column assignment, not a label. Flatten it and every value beneath it moves.
Fiscal year adds a definition problem the extraction cannot solve but can at least expose. A column labeled 2024 may end in January, or in June, or in a 52/53-week period that lands a few days off the calendar. Comparing it with a December year-end peer is a mistake in the analysis, not in the parse, and the only defense is to keep the full period label ("fiscal year ended 31 January 2024") rather than the four digits.
A Note Reference Travels With the Number and Is the First Thing Stripped From It
In a 10-K, the number you need is often on the statement and the reason it means what it means is in a note sixty pages away. The statement signals that with a marker: "See Note 12", a superscript 1, an asterisk, or a bracketed "(1)" printed against the figure.
Number parsers remove that marker because it is not part of the value, and the removal goes wrong in a predictable way. A cell reading 1,234(1) can come back as 1,234, as 1,2341, or as 1,234.1 depending on how the superscript is separated in the text layer. The markup that was supposed to send a reader to the explanation arrives as a corrupted digit.
The subtler failure has no corrupted characters in it. Rows labeled "Other, net", "Miscellaneous" or "Other income (expense)" aggregate several items, and the note is where the aggregation is broken out. Extract the row and you have a correct number that cannot be decomposed, which means it cannot be compared with a peer whose "Other" contains different things. Policy has the same problem: whether a charge sits in cost of sales or in selling, general and administrative expense is stated in the note, and it changes gross margin without changing a single figure on the face of the statement.
This is a boundary worth stating plainly. An extraction can capture "Note 12" as a column value so a reviewer can navigate to the right page. It does not resolve the note, follow the cross-reference, or pull the note's own table. That work stays with the person reading the filing.
In MD&A the Reading Order Is Column by Column, and Text Extraction Reads Line by Line
The narrative sections of a 10-K, particularly management's discussion and analysis, are frequently set in two or three columns to fit more text on a page. A human reads down the left column, then down the right. A text extractor reads across the page, line by line, because that is the order the characters appear in the content stream.
The result is either interleaved prose, where a sentence about revenue picks up mid-clause in a sentence about liquidity, or a column read twice while the other is dropped. Neither looks like a data error, so it passes review. It becomes one when a sentence that reads "gross margin increased" was assembled from two different columns and the filing said the opposite.
This is the section where PDF extraction earns its place rather than competing with structured data. XBRL tags the figures. It does not tag the explanation for why the figures moved, the pricing pressure management names, or the contract that expires next year. If the point of reading the filing is to understand the business rather than to fetch a number, the narrative is the part that matters, and reading order is the whole game.
A Correct Extraction Keeps Four Fields That Are Not Figures
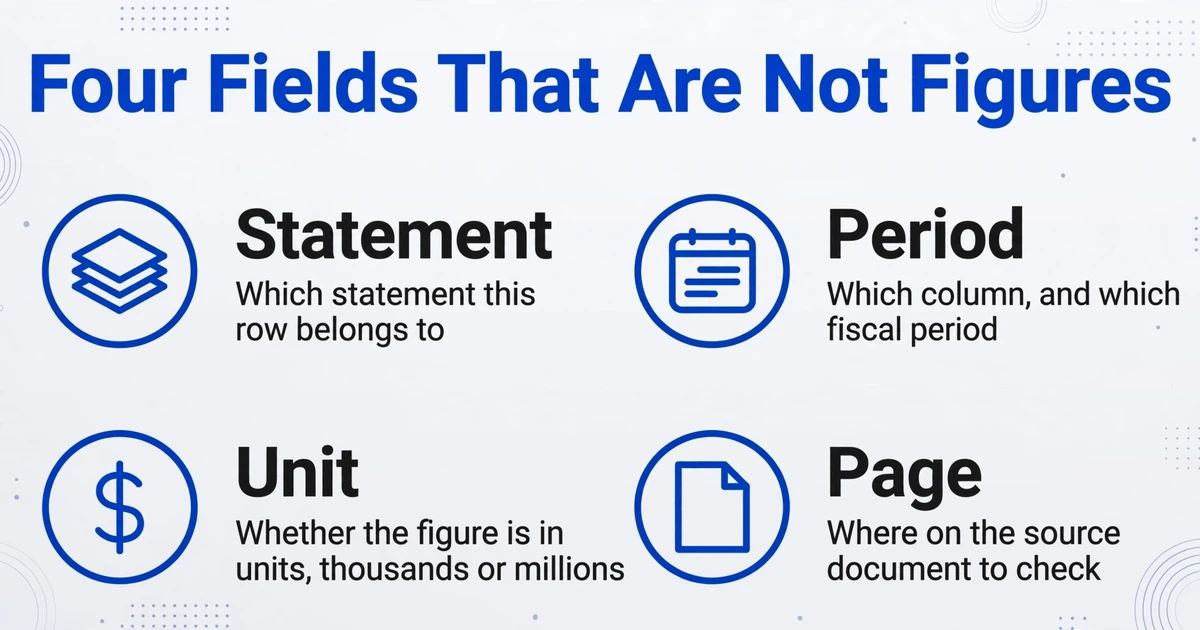
A correct 10-K extraction is measured by provenance: every figure still knows where it came from. Four fields do that work, and each one answers a question that the number alone cannot.
| Field | What it answers | What goes wrong without it |
|---|---|---|
| Statement | Which statement this row belongs to | Totals from different statements get compared, and the reconciliation fails on the wrong row |
| Period | Which column, and which fiscal period it actually covers | Prior-year figures land under the current year, and every change has the wrong sign |
| Unit | Whether the figure is in units, thousands or millions | Every value is off by a factor of 1,000 while the cell looks ordinary |
| Page | Where on the source document to check | Review becomes a search through the PDF, so errors are accepted rather than verified |
| Row level (optional) | Whether the row is a detail line or a subtotal | Summing the column counts the same money two or three times |
The unit field deserves the emphasis it gets because it is the most expensive thing a parser drops. A Suffolk University study put an untrained LLM against 5,000 annual reports filed between 2014 and 2023, asking it to retrieve 26 accounting metrics. About half of the errors it made were scaling errors, and the rates were 8.16% from text, 5.81% from HTML and 0.11% from XBRL (XBRL US summary of the study).
The digits in a 1,000x error were read correctly. What failed was carrying a caption that sits outside the grid, and a cell holding an ordinary number never flags it.
That is why the fix is a column rather than a model instruction to read harder. The same logic covers parentheses and subtotal hierarchy, the two other conventions that decide whether a statement ties out, and those are set out in the breakdown of why statements lose units, signs and subtotals.
The Setup That Works Is Boring: Context Columns First, Then a Row Shape
ImageToTable.ai reads the page with a vision model and fills columns you name, rather than mapping fixed coordinates, so the fields that carry context can be requested the same way as the figures. The concept is Custom Column Extraction: you type the column names you want, and the AI locates each value by what it means anywhere on the page.
Two row shapes cover most filing work, and the rest is about keeping filings apart and checking the result.
Long: one row per line item, for a full statement
Name the columns Company, Statement, Line Item, FY2025, FY2024, Unit, Note Reference and Page. Every row is one line of one statement, with its period, scale and source page attached. This is the shape to use when you need the statement itself, because every printed line, including the subtotals, comes back as its own row.
Wide: one row per filing, for a peer comparison
Name the line items you compare as columns, such as Revenue, Gross profit, Operating income, Net income, Total assets and Operating cash flow, with a Fiscal Year column. One filing becomes one row, which is what a comparison sheet wants.
Batch: one spreadsheet for the peer set
Batch processing takes several filings at once and merges the results into one Excel file, with a Company column keeping them apart. Eight 10-Ks become one sheet rather than eight. This is where label variation stops being a problem: one company prints "Total revenues", another "Net sales", a third "Total net revenue", and semantic matching resolves them into the same column, which a coordinate template cannot do.
Check: point the cell back at the page
Review Mode with bbox locating highlights the exact region a value came from when you hover the cell, and clicking a region on the page jumps back to its cell. Use it on the two things a cell cannot show you: which statement the row belongs to, and which column the value sat under. Model Tier matters for the same reason on older material. A clean printed statement is fine on the standard tier; a dense scan, a photocopied annual report or a footnote-heavy page needs a higher one.
A computed column can take one more step without adding a second tool. Because row-level arithmetic is evaluated during extraction, a column defined as the difference between the two period columns returns the printed change, provided both columns are in the same unit. It has no way to know that one statement is in thousands and the next in millions, so a cross-scale comparison needs the multiplier supplied explicitly in the rule. Even then it will not tell you whether the change is meaningful. That remains yours.
What happens after extraction, matching each statement line to the line your own template expects, is the mapping work that financial statement spreading describes. The tool fills a row. The analyst decides where that row belongs in the model.
Files are processed securely and not stored.
If the Filing Is on EDGAR, the Tagged Figures Are Usually the Better Source
Inline XBRL has been mandatory for operating company financial statement information since 2019 for large accelerated filers, 2020 for accelerated filers, and 2021 for everyone else (SEC press release 2018-117). For a filing that carries it, the tagged facts are already separated from the layout, and pulling them is a different and often better job than reading the PDF. Saying that is part of giving a straight answer.
XBRL is the right path when you need reported numeric facts at scale: screening a universe, calculating ratios across periods, comparing one line across twenty companies. Its limits are real but different from a parser's. Companies extend the taxonomy with their own tags, which weakens cross-company comparison; a fact arrives without the printed presentation, so the subtotal structure and the ordering a human reads are not in it; tagging itself contains errors, with sign conventions a recurring one; and the narrative sections are not tagged at all.
PDF extraction is the right path in four situations, and they are common enough to plan for. The filing is a scan or an image-only PDF with no usable text layer. The document predates XBRL tagging, which began in 2009. The package you were given is not an EDGAR filing at all, such as a printed annual report, a broker's compiled peer set, or a foreign parent's local report. Or the thing you need is the narrative, where there is no structured source to prefer. When the filing is a scan of several hundred pages, the page handling becomes its own problem, covered in how to OCR a PDF that runs to thousands of pages.
ImageToTable.ai does not parse XBRL, does not resolve footnotes or follow cross-references, and does not build a model. It turns the pages you give it into a table whose rows carry their statement, period, unit and page. Using it on a filing that already has clean tagged data would be choosing the harder path.
Frequently Asked Questions
Can I extract a 10-K's financial statements from a PDF into Excel?
Yes, and the useful output carries more than the figures. Name columns for the statement, the period, the unit and the page alongside the line items and the values, so each row in the spreadsheet can be traced back to a page. Without those fields the export is a grid of numbers whose meaning depends on a layout you can no longer see.
Why do the numbers land under the wrong year column?
Two causes account for most of it. The header on a continuation page is missing, so the parser assigns the nearest header it can find. Or the header is a merged, multi-level cell (a year spanning two sub-columns, an "As Adjusted" column beside a reported one) and flattening it shifts every value by one or two positions. Check the first three rows against the source page before trusting the column order.
How do I stop "in thousands" from making every figure wrong?
Capture the caption as its own column instead of assuming it. The declaration sits outside the grid, so a parser reading columns never sees it, and every value comes back correct to the digit and wrong by a factor of 1,000. Keep the multiplier in one place, apply it once, and remember that qualifiers such as "except per share amounts" mean some rows are not scaled at all.
Does it read the footnotes?
It can capture the note reference printed against a line, such as "Note 12", as a value, which helps a reviewer find the right page. It does not resolve the reference, open the note, or bring the note's table into the output. If the number you need exists only inside a note, upload the pages that contain it and extract them as their own table.
Is XBRL better than parsing the PDF?
For reported numeric facts, usually yes. The tagged data is already separated from layout, and the error rates reflect it: a study of 5,000 annual reports found scaling errors in 0.11% of XBRL retrievals against 8.16% from plain text. For narrative, for scanned or image-only copies, and for documents that were never filed on EDGAR, there is no structured source to prefer.
Can it handle a scanned or older 10-K?
Yes. A vision model reads the page rather than a text layer, so a scan or a photocopy works, and a higher Model Tier helps on faint print, dense footnotes and skewed pages. The practical limit is source quality: if a page was copied at an angle and a digit is genuinely unreadable, no extraction recovers it, and Review Mode is how you find those cells instead of trusting them.
The Context Is the Part Worth Extracting
A 10-K defeats a general PDF parser because the document stores meaning in places a parser treats as decoration: the statement title, the merged header cell, the caption above the grid, the superscript beside a figure, the column layout of a page of prose. Strip those and you still have every digit, arranged in a way that no reconciliation can confirm.
So the test for any extraction is whether a row can answer four questions without leaving the spreadsheet: which statement, which period, which unit, which page. If it can, a reviewer can check it in seconds and an analyst can defend it in a meeting. If it cannot, the numbers are guesses wearing the costume of data.