How to Read an Offering Memorandum
Before You Underwrite
An offering memorandum arrives with a price on the cover and a yield beside it, and for the first ten pages every number looks like it came from the same place. It did not. The price is the seller's position. The yield is usually computed from income the property has not earned yet. The only figures in the book a buyer can test against a record are the rent roll and the trailing twelve months, and they are usually the plainest pages in the packet, printed after the renderings and the aerial photos.
That division of labor is how the document is designed. Fannie Mae's multifamily guide does not underwrite from a broker's package; it tells the lender to obtain operating statements, a current rent roll and three months of vacancy history, then reconcile any variance before the loan is sized. The OM is a sales document, and its own last page usually says so. Reading it well means separating numbers that are facts from numbers that are positions and numbers that are projections, all of which arrive in the same typeface.
Key Takeaways
- $859,000 of the asking price sits between the 6.10% on the cover and the 5.68% the same document supports.
- A rent roll, a T12 (trailing twelve months) and a pro forma all print in one typeface, so a cap rate can describe a year that has not happened yet.
- Put the NOI (net operating income) basis and the rent roll date in one table and twenty books separate faster than any careful reading.
An Offering Memorandum Is a Broker's Sales Document, Not a Disclosure Document
An offering memorandum (OM) is a marketing package that a listing broker prepares for one property, and no standard form or regulator defines what goes in it. The broker writes it for the seller, usually after a buyer signs a confidentiality agreement and before a call-for-offers date. Its job is to produce offers, which is why the first pages are renderings, aerial photos and a summary of the upside, and why the rent roll and the operating history come later and plainer.
The physical form varies more than the outline suggests. A suburban strip center might run 25 pages. An institutional apartment book can pass 100, with a financial exhibit bound separately. Some are exported from design software with live text; others are scans of a printed book, which matters if you plan to work with the numbers rather than just read them.
There is no required order or vocabulary. One brokerage opens with Investment Highlights, another with Executive Summary, and a third puts the financial summary ahead of the property description. Retail books carry rent schedules by suite; multifamily books carry unit mix. The section names change with the asset class and the firm, and the numbers you want move with them.
| Section | What it holds | What it can actually prove |
|---|---|---|
| Executive summary | Price, headline cap rate, unit count, investment highlights | The seller's position |
| Property description | Year built, unit mix, renovations, amenities, site, zoning | Physical facts, some checkable against permits |
| Rent roll | Unit or suite, tenant, lease dates, contract rent, concessions | Who owes what on the as-of date |
| Financial summary | T12 and pro forma columns, expense lines, NOI | What the property earned, if the period is printed |
| Market and comps | Submarket stats, rent and sale comparables | The broker's selection of the evidence |
| Pro forma and assumptions | Rent growth, vacancy, expense growth, capex, exit cap | A plan, priced as if it had already happened |
| Deal process | Confidentiality agreement, tours, offer date, deposit | The mechanics of the transaction |
| Disclaimer | Information is not guaranteed; buyer must verify | That this is not a disclosure document |
The phrase also has a second life outside property sales. In securities, an offering memorandum usually means a private placement memorandum for an unregistered investment offering, built around subscription agreements, sponsor fees and risk factors. If the document in front of you is discussing accredited investors and a promote, you are reading the other one. The property OM is a sales package for a building.
The last page of an OM usually says the information is not guaranteed and the buyer must verify it. That is not boilerplate. It is the document telling you what it is.
Every OM Prints Three Clocks in the Same Typeface
A rent roll, a T12 and a pro forma measure three different moments, and the OM is the only document that prints all three side by side. Each has a different author, a different time frame and a different claim on the truth, which is why a number can be repeated in three places inside one book and mean three things.
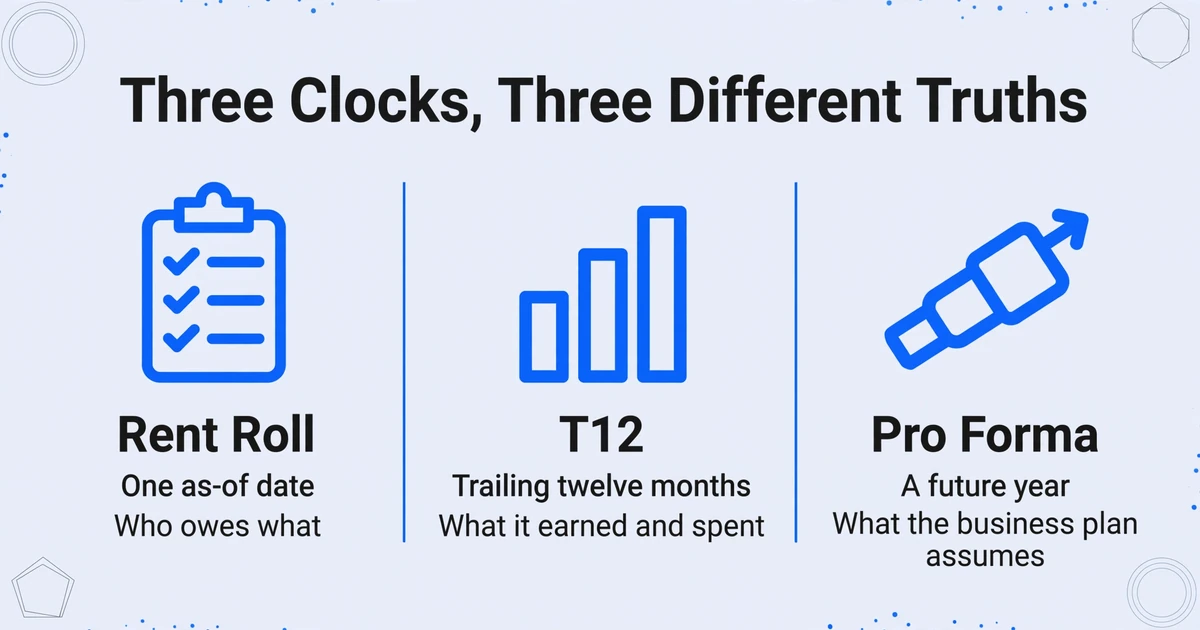
The rent roll is a schedule, not a receipt. It lists every unit or suite as of a printed date, with the tenant, lease dates, contract rent, concessions and often the balance due, and it answers one question: who owes what today. The T12 is the property's operating statement for the trailing twelve months, month by month, ending at net operating income, and its monthly columns carry the evidence of whether a cost was a single event or a pattern.
A pro forma is a forward year under a business plan that has not been executed: vacant units leased, below-market rents rolled, expenses reduced, capital spent. It answers the question the seller wants you to ask, which is what the property could do.
| Document | Prepared by | Clock | Question it can settle | What it cannot answer |
|---|---|---|---|---|
| Rent roll | Property manager or seller | One as-of date | Who occupies what, and what they owe | What was collected, or what it cost to run |
| T12 | Property accountant or manager | Trailing twelve months | What the property earned and spent | Current occupancy, market rent, whether a cost recurs |
| Pro forma | Listing broker or seller's analyst | A future year | What the business plan assumes | Whether any of it has happened |
The OM is a restatement of the first two and an argument about the third. It can annualize a short period, add back a one-time cost, mark rents to market, or drop a management fee because the owner self-managed. Each adjustment may be defensible. None of them announces itself as an adjustment in the summary table, and that is the part a reader has to catch.
Four roles read the same book and take different things from it. The listing broker has to keep the story consistent with the numbers. The buyer's analyst needs price, NOI basis, unit mix, rent roll date and expense load to decide whether the deal deserves a tour and a diligence budget. The lender does not size a loan from the OM at all; the loan is sized from statements, the current rent roll and a vacancy history. The property manager reads the unit mix and expiration schedule to see what the buyer was promised.
A practical order follows from the three clocks. Skip the narrative on the first pass. Open the financial summary, write down the NOI and the label printed beside it, find the rent roll date and the T12 period end, then read the expense detail. The investment highlights read differently once you know which number they are defending.
The statement itself has its own traps, from the thirteen-column export to the treatment of recoveries, covered in what a T12 operating statement shows and hides. For the OM, the useful discipline is simpler: know which of the three clocks you are reading before you use the number.
The three documents are not three versions of one truth. A rent roll dated today and a trailing twelve-month statement can both be correct and disagree by six percent.
The Cap Rate on the Cover Has a Hidden Numerator
A cap rate is net operating income divided by price, so the only thing that makes the number on the cover meaningful is which NOI the broker put on top. The rate itself is a single number, and a single number cannot tell you whether it describes the last twelve months, an annualized stub, a stabilized year, or a year that begins after the renovation.
Direct capitalization converts one year of income into a value indication by dividing it by a market rate. The arithmetic is simple and the assumptions are not. Freddie Mac's guidance on capitalization rates notes that only the first year's income is explicitly considered, and that the market's expectation for growth is hidden inside the rate itself. Two properties can print the same cap rate while carrying very different assumptions about what happens next.
In an OM, the more common problem comes before the rate. The cover states a rate, the financial summary states an NOI, and the two are not always built from the same year.
| Figure | What the OM prints | What the same book supports |
|---|---|---|
| Asking price | $12,400,000 | $12,400,000 |
| NOI used for the cover | $756,400 (year-one pro forma) | $704,000 (trailing actual) |
| Cap rate at the asking price | 6.10% | 5.68% |
| Price supported at 6.10% | $12,400,000 | $11,541,000 |
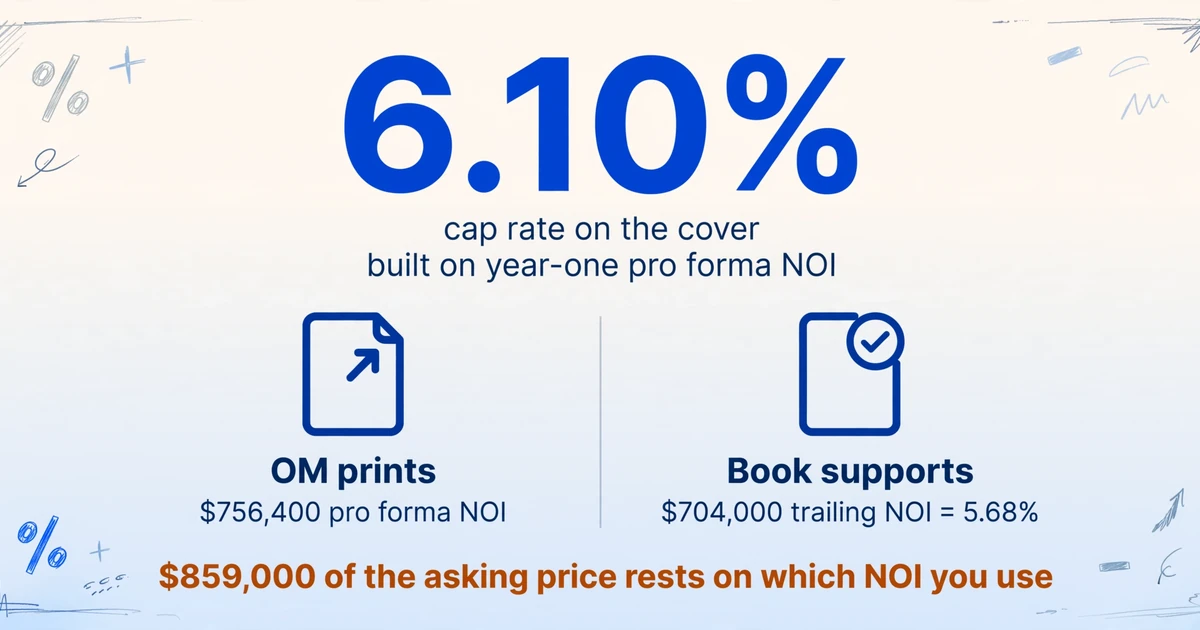
At $12,400,000 and 6.10%, the implied NOI is $756,400. The trailing column in the same book shows $704,000. Divide that by the asking price and the property is yielding 5.68%. At the OM's own 6.10%, the trailing income supports $11,541,000. The NOI difference is $52,400. The price difference is $859,000.
Nothing in that sequence is dishonest. The cover answered a question the buyer was not asking, and the answer was printed forty pages later in a smaller font.
The second gap sits below NOI. Net operating income stops before capital expenditure, which is why Fannie Mae's guide deducts the replacement reserve after Underwritten NOI and sets a floor of $250 per unit per year. On a 48-unit property that is $12,000 a year the buyer has to fund whether or not the OM shows the line. Capitalized at the same 6.10%, it is about $197,000 of price that the cap rate never mentions. The guide's NOI definition is effective gross income minus operating expenses, with debt service and capital below it.
Two cap rates are therefore only comparable if both were built the same way. If one seller deducts reserves above NOI and another leaves them below, the same property can print two different rates without either number being wrong. An exit cap below the going-in cap raises the same issue at the end of the hold: it assumes cap rate compression, which is a bet on the market rather than an operating plan.
A stated cap rate is only as meaningful as the NOI behind it. When the OM does not say which NOI it used, the silence is the answer.
Six Checks Rebuild the Stated NOI From the OM's Own Pages
The fastest way to find a soft number in an OM is to rebuild the NOI from the document's own pages instead of arguing with the broker's total. Six checks cover most of what moves a multifamily or mixed-use book, and each one ends with a question for the broker rather than a conclusion you have to defend alone.
| Check | Where it hides | What it does to the price |
|---|---|---|
| Tie the rate to the price | Cover rate against the NOI in the financial summary | If price times rate does not reproduce the printed NOI, one of the three is mislabeled |
| Find the management fee | Often absent on a self-managed property | 3% of EGI is the agency floor; on $980,000 that is $29,400, about $482,000 of price |
| Compare vacancy with the agency floor | Pro forma assumptions page | Vacancy, concessions and bad debt together should reach 5% of gross potential rent; two points on $1,050,000 is $21,000, about $344,000 of price |
| Look for a replacement reserve line | Expense detail, or its absence | $250 per unit per year at the agency minimum, and the buyer funds it either way |
| Re-underwrite the taxes | Pro forma expense lines | If the jurisdiction reassesses on sale, the seller's bill is not the buyer's bill |
| Test other income for recurrence | T12 monthly columns | A one-time payout repeated as annual income is not income |
The management fee and the vacancy floor are worth spelling out because both have an external reference point. Fannie Mae's small-loan underwriting takes the management fee as the greater of 3% of effective gross income, the actual fee, or the appraiser's market fee, so a zero on a self-managed property is not a zero to a lender (Fannie Mae Multifamily Guide). The same table requires physical vacancy, concessions and bad debt to total at least 5% of gross potential rent outside New York and San Francisco, with a 3% floor in those two markets. A pro forma carrying 3% vacancy and no concessions or bad debt in a market running 7% is not conservative. It is below the floor the agency will underwrite.
Expense classification is the check no summary table can do for you. The same cost can sit in repairs and maintenance or in payroll depending on who built the book, which moves the expense ratio while leaving NOI untouched. A broker answering a question about moving an OM into Excel described it plainly: "Some brokers will put contract services into R&M, others may include admin expenses in their payroll calculation" (r/CommercialRealEstate, 2019). That is an argument for reading line items before comparing expense ratios.
Errors are usually arithmetic rather than strategic, and one line is enough to move a price. A listing broker describing a reissue on the same forum wrote that an error had overstated in-place NOI by about $40,000, which moved the cap rate on an unchanged asking price from 8.5% to 8.0% (r/CommercialRealEstate, 2020). Those two rates imply an asking price near $8,000,000, and at 8.5% the corrected income supports $7,529,000. One row, half a million dollars.
Mapping the printed expense lines onto your own categories is the same discipline as financial statement spreading: the number stays the same, the bucket changes, and the comparison only works when every property is in the same buckets. The OM gives you its buckets, which are not yours.
None of these checks tells you whether the property is a good buy. They tell you where the seller's number stops being a fact, which is the only thing a document can settle before diligence starts.
When the Rent Roll and the T12 Disagree, Name the Gap Before You Explain It
The rent roll records what tenants owe on one date and the T12 records what arrived over twelve months, so a gap between them is expected. The size and the cause are what matter. Annualize the rent roll's contract rent and set it against the T12's rental income. That is the highest-yield comparison in the package, because it is mechanical and it catches several unrelated problems at once.
| Line | Amount |
|---|---|
| Rent roll: 46 of 48 units occupied, monthly contract rent | $92,000 |
| Annualized scheduled rent (× 12) | $1,104,000 |
| T12 gross potential rent | $1,116,000 |
| T12 vacancy, concessions and bad debt | ($78,000) |
| T12 net rental income | $1,038,000 |
| Gap between annualized rent and collected rent | $66,000 (6.0%) |
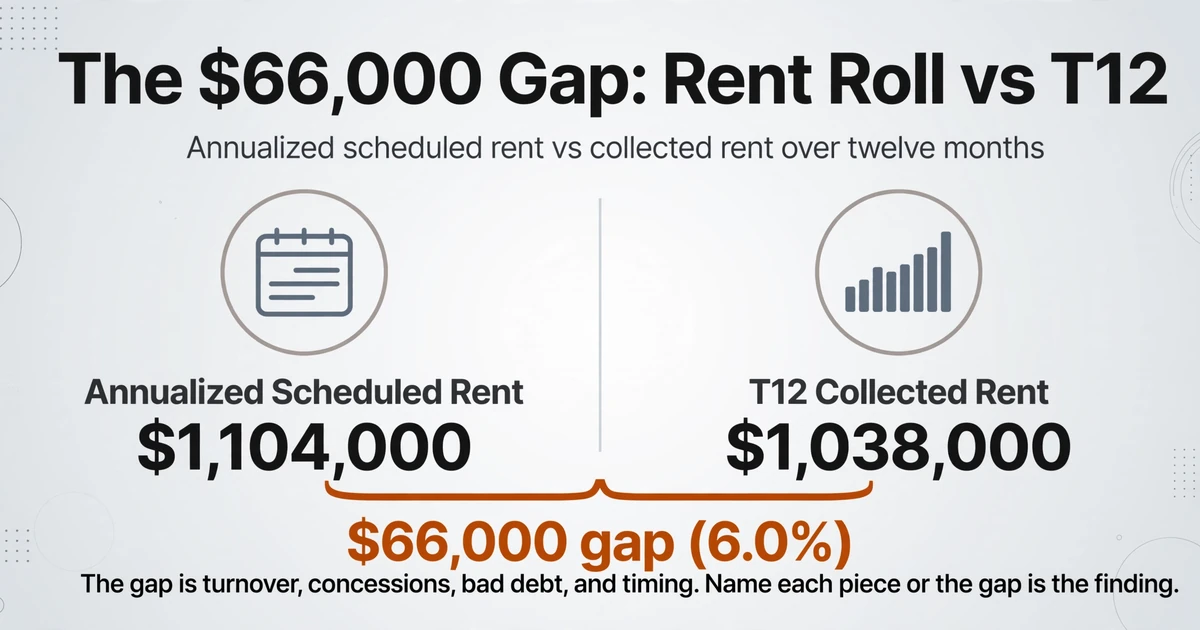
The $66,000 is not automatically a problem. It is made of turnover downtime, concessions still running, bad debt, mid-year rent increases, and the timing difference between billing and collection. If you can name each piece, the gap is a finding. If nobody can, the gap is the finding.
Occupancy splits the same way. Forty-six of forty-eight units is 96% physical occupancy. Net rental income of $1,038,000 against gross potential rent of $1,116,000 is 93% economic occupancy. Both numbers are true, and a lender cares about the second one.
One lease can widen the gap without anyone misstating anything. A lease signed with a commencement date after the rent roll date appears on the schedule at full rent and contributes nothing to the T12. The unit is occupied on paper and empty in the collections. Ask for commencement dates on any unit signed in the last ninety days, and ask whether the rent shown is face rent or net of free months and allowances.
The as-of date is the other quiet difference. If the rent roll predates the end of the T12 period, the gap includes every leasing event in between, and the two documents are measuring different months. Before a letter of intent, ask for a rent roll dated inside the current month.
A rent roll line is a summary of a lease and its amendments. When the two disagree, the lease wins. That is a document problem before it is a spreadsheet problem, which is why lease extraction for property management is its own discipline. If the lease file is where your review keeps landing, the comparison of lease data extraction tools covers that side specifically.
The OM also travels inside a larger package: rent roll, T12, leases, tax bills, insurance, service contracts, and later estoppels. Missing pages and mismatched periods are the usual failure there, which is the subject of assembling a real estate closing document package.
A gap you can decompose line by line is a finding. A gap nobody can explain is the finding.
Twenty OMs in One Market Are a Table Problem, Not a Reading Problem
An analyst screens thirty books to make one offer, and the work only becomes tractable when every OM lands in the same columns. Reading one book well is a skill. Reading thirty is a different job, because the values sit in a different place in every book and the comparison lives in your head until something puts them side by side.
The unit count is on page 2 in one book and in a table on page 14 in another. The cap rate is on the cover in one and only in the financial summary in the next. Custom column extraction is the mechanism that makes the second job possible: you type the column names you want, and the AI locates each value by what it means rather than where it sits on the page. The names you type become the headers of the output table, so a national brokerage's book and a two-person shop's book land in the same columns.
| Column | What it captures | Why it belongs in the row |
|---|---|---|
| Property name | The asset as marketed | Identifies the asset across the comp set |
| Address | Submarket and jurisdiction | Tax reassessment and rent control are local |
| Asking price | The seller's number | Denominator of every rate you will compute |
| Units | Count from the rent roll | Price per unit and reserve arithmetic |
| Year built | Property description | Reserve and capital expectations |
| Rent roll as-of date | The date printed on the schedule | A rent roll without a date cannot be tied to anything |
| Occupancy (as stated) | The headline percentage | Usually physical, rarely economic |
| NOI (as stated) | The figure the book uses | Meaningless without the next two rows |
| NOI basis | Trailing, annualized, pro forma or stabilized | The single most important label in the book |
| T12 period end | The last month in the statement | Tells you how old the actuals are |
| Trailing NOI | From the T12 column | The number you can rebuild |
| Pro forma year-one NOI | The seller's forward year | The number the price is usually built on |
| Total operating expenses | From the financial summary | Expense ratio and comparability |
| Management fee | Expense detail, or its absence | Often missing on a self-managed book |
| Stated cap rate | Cover or summary | Test it against price and NOI |
Two column types do work a printed label cannot. An inferred column reads the language and classifies it: a column called Marketing Positioning with the options Stabilized, Value-add and Lease-up turns "below-market rents and a renovation plan" into a sortable field. It is honest about what it records, which is the pitch, not the condition of the building. A computed column calculates a value from other fields on the same row instead of reading it off the page, so Price per Unit (Asking Price ÷ Units), Implied NOI (Stated Cap Rate × Asking Price) and NOI Gap (Pro Forma Year-One NOI − Trailing NOI) arrive as values rather than formulas you rebuild in every sheet.
Batch processing turns the columns into a comparison, but a 60-page book first has to collapse into one record. Set Multi-Page Merge to group the batch by property address or by the deal's reference number, and every page of the same book folds into one row instead of leaving sixty page-level rows to clean up. If the financial exhibit arrives as a separate PDF with the same address on it, it lands in that row too. Upload the books together and the result is one table, sorted by NOI gap or by implied cap rate, which is the comparison thirty separate readings could not produce.
| Property | Ask | Units | Stated cap | NOI basis on the cover | Trailing NOI | Gap to pro forma |
|---|---|---|---|---|---|---|
| A, 1998 build | $12,400,000 | 48 | 6.10% | Year-one pro forma | $704,000 | $52,400 |
| B, 1972 build | $6,900,000 | 24 | 5.75% | Stabilized | $352,000 | $44,750 |
| C, 2016 build | $28,500,000 | 96 | 5.40% | Trailing | $1,539,000 | $0 |
Review mode is the part that matters for a document you will be asked to defend. Hover any extracted cell and the source page highlights the value it came from, and the label printed beside that value is usually the finding. Turn on auto-annotate after processing and a stack of books is ready to check when you open it, instead of one file at a time.
When the document does not print a value, leave the cell blank. A missing T12 period, a management fee with no line, a rent roll with no date: the empty cell is the question you send the broker. Filling it with an industry average destroys the only signal the document gave you.
The Table Moves the Numbers; Four Judgments Stay With the Analyst
Extraction removes the transcription, not the underwriting. Four judgments in an OM cannot be resolved by reading the document more carefully. They need market evidence, a contractor, a tax assessor or a lender, and none of them lives in the PDF.
The first is whether the market rent comp set is genuinely comparable: same submarket, similar size, similar lease structure, recent date. A comp set selected by the party setting the price is evidence of a position, not a survey of the market.
The second is whether the capital plan is funded and scheduled. A pro forma that renovates every unit and raises rents needs a budget, a downtime assumption and someone to do the work. Without those, the uplift is a wish with a number attached.
The third is whether the tax reassessment lands where you think. Reassessment on sale is jurisdictional, so a pro forma that holds the seller's bill flat is correct only where it does not happen. On a property that has not traded in a decade, this can move year-two NOI by several percent.
The fourth is whether the exit cap assumes compression. A lower exit than entry is a market bet, and it belongs in a sensitivity table rather than a base case. The rest of the underwriting, including the debt, the partnership waterfall and the return hurdles, is not in the OM at all.
Several things sit outside the OM entirely: environmental findings, title, physical condition, estoppels, service contracts and the purchase agreement. They arrive later, and they can re-price the deal after the OM has done its job.
The OM's job is to make the deal feel inevitable. The buyer's job is narrower. Find the two numbers that would change the price if they moved. In most books those are the NOI basis and the rent roll date, and both are printed, usually without emphasis.
Put twenty books in one table and those two columns separate the deals faster than any amount of reading. What you keep is the row, the label and the page behind it, which is what survives the credit committee, the partner meeting and the lender's questions.
FAQ
What is the difference between an offering memorandum and a pro forma?
An OM is the whole marketing package. A pro forma is one section inside it, or a separate model, that projects a future year of income and expenses. An OM can contain three pro formas and no T12, which is itself a finding about how much of the deal is evidenced.
Is an offering memorandum the same as a private placement memorandum?
No. A property OM markets a building to buyers and has no securities status. A private placement memorandum markets an investment in a fund or syndication and is built around securities disclosure, subscription agreements and risk factors. The names overlap; the documents and the rules do not.
Can I trust the cap rate in an OM?
Use it as a claim, not a result. Multiply the asking price by the stated rate and see whether the product matches the NOI printed in the book. Then recompute the rate on the trailing NOI. If the two rates differ, the difference is the amount of future work priced into today's number.
What should I ask for after reading an OM?
A rent roll with an as-of date inside the current month, the T12 by month, three years of operating statements if they exist, the current tax bill, the capital expenditure history with invoices, and the lease file for the largest tenants. Fannie Mae's guide asks lenders for three years of statements and a three-month vacancy history, which is a fair indication of what a serious review needs before a loan is sized.
What if the OM has no T12?
Then you have a brochure, not an underwriting package. Ask for the statement before spending time on the deal. If the answer is that full financials come after a letter of intent, that is a decision about how much diligence you are willing to fund before you can test the price, and the offer should reflect it.
Can AI extract data from an offering memorandum?
Yes, for the fields the document prints. A custom column setup pulls price, NOI, cap rate, occupancy, unit count, rent roll date and expense lines into one row per property, and review mode links each cell back to the page. It does not reconcile the rent roll to the T12 or tell you whether the pro forma is achievable.
How long does it take to read an OM?
A screening pass on the four figures that decide whether to continue (price, NOI, the NOI basis and the rent roll date) takes about fifteen minutes once you know where they sit. A full read only makes sense after the deal passes that screen. The reason to build a table across books is that most of them fail the screen, and the table shows which few deserve the fifteen minutes.