What a T12 Operating Statement Shows,
and What It Hides
A T12 is the operating statement a property manager exports when someone asks how the building actually performed over the last year. It arrives as a PDF or a spreadsheet, usually between 40 and 120 line items, with one column for each month and a total at the right. The monthly columns are what make it useful. The total is the reason most people misread it. It is also the document most often confused with the rent roll and the pro forma that arrive beside it.
Key Takeaways
- A 12-month T12 operating statement usually has 13 numeric columns, and counting the total as a month breaks every average built on that grid.
- Two T12s can print the same net operating income (NOI) and still not be comparable, because $36,000 of utility reimbursements booked as income or netted against the utility bill moves the expense ratio and leaves NOI alone.
- The annual total is a summary of a year you cannot see, so run the five checks and keep a page reference behind every value.
A T12 Is the Last Twelve Months of Operations, One Column per Month
A T12, or trailing twelve months, is a property's income and expense statement for the most recent twelve consecutive months, presented month by month with a period total, ending at net operating income. A statement labeled "T12 September 2026" covers October 2025 through September 2026. It does not follow the calendar year, and that is the point.
Outside real estate, the same rolling window is called TTM or LTM. In commercial real estate, "T12" almost always means this operating statement rather than a general finance metric. The shorter versions exist too: a T3 covers three months and a T6 covers six. They answer a narrower question, which is whether something changed recently, and they are more exposed to seasonality, a single large repair, or a tax installment that happens to fall inside the window.
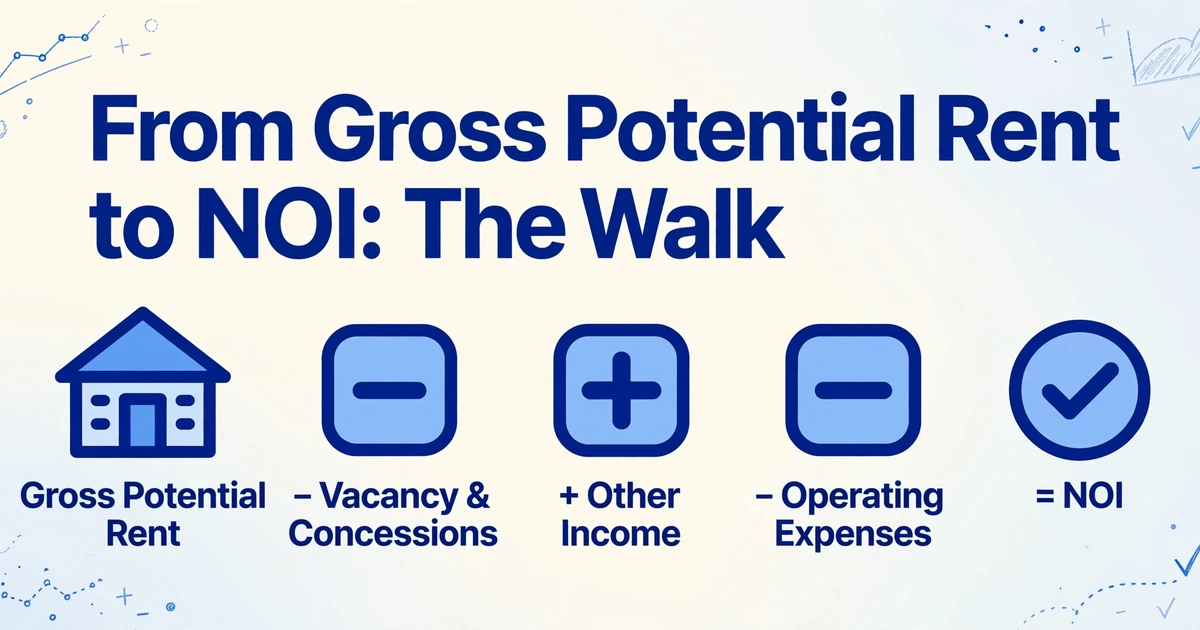
The rows follow a standard walk even when the labels do not. Gross potential rent at full occupancy, then the deductions that turn it into cash: vacancy, loss to lease, concessions, bad debt. Other income follows, from parking, laundry, storage, pet fees and utility reimbursements. Gross potential rent minus those deductions plus other income gives effective gross income. Subtract operating expenses and you reach net operating income.
Debt service, capital expenditure, depreciation and income taxes sit below NOI. Fannie Mae's Multifamily Guide defines NOI as total effective gross income minus operating expenses, and lenders size debt service coverage from that figure (Fannie Mae Multifamily Guide). Replacement reserves are the arguable line. Some statements deduct them above NOI and some leave them below, which is one reason two "NOI" figures for the same property can both be defensible.
The trailing window is also the period institutions report on. The NCREIF PREA Reporting Standards report trailing-twelve-month NOI for each property as a data element, and where a recently acquired asset is annualized for comparability, the figure has to be disclosed as annualized (NCREIF PREA Reporting Standards, 2025). A calendar-year statement can be fourteen months old by the time a deal reaches you. A T12 ending with the most recent closed month is the freshest complete year that exists.
A T12 with no period end printed on it cannot be tied to a rent roll, a lease date or a loan application. The date is part of the data.
A T12, a Rent Roll and a Pro Forma Answer Three Different Questions
A T12 records what the property earned and spent, a rent roll records who owes what today, and a pro forma records what a new owner believes the property can do. They are read together because none of them is complete on its own.
| Document | What it records | Time | What it cannot tell you |
|---|---|---|---|
| T12 operating statement | Monthly actual income and operating expenses, ending at NOI | Trailing 12 months | Current occupancy, market rent, whether a cost recurs |
| Rent roll | Unit or suite, tenant, lease dates, scheduled rent, concessions, delinquency | One as-of date | What was collected, what it cost to operate |
| Pro forma | Projected income, expenses, capex and cash flow under a business plan | Forward, usually the hold period | Whether any of it has happened |
Each document has a different author and a different job. The property manager produces the T12 from the accounting system, because the manager keeps the books. The asset manager reads it against the prior quarter and against the other properties in the portfolio. The acquisition analyst ties its income to the rent roll and builds the pro forma from the result. The lender re-underwrites the NOI and tests it against debt service. The appraiser capitalizes it.
The rent roll tie is the most useful of these relationships. Annualize the in-place rents on the rent roll and compare the result with rental income collected on the T12. That difference is normal. It is made of vacancy, concessions, bad debt, loss to lease, mid-year rent increases, and timing between billing and collection, mixed together. A gap you can decompose line by line is a finding. A gap nobody can explain is the finding. The lease-level side of that comparison is its own extraction problem, covered in lease extraction for property management.
In a sale, the T12 usually travels inside a larger package with the rent roll, the leases and the tax bills. That package is where a missing page or a mismatched period becomes expensive, which is the subject of assembling a real estate closing document package.
A rent roll and a T12 that tie to the dollar are more suspicious than a gap you can explain, because collected rent and scheduled rent are different measurements.
Every T12 Is Prepared by a Different Property Manager
The statement is an export from a property accounting system, not a form, so the column count, account names, signs and accounting basis change with the preparer. Yardi, RealPage, AppFolio, MRI, Entrata and QuickBooks all produce something a broker will call a T12. None of them produces the same layout.
The column count is the first trap. A twelve-month statement usually has thirteen numeric columns: twelve months and a total. If the export starts or ends mid-month, or carries a year-to-date column next to the trailing period, there are fourteen or fifteen. A check that treats every numeric column as a month will count the total as a period. Every monthly average, trailing-three-month figure or seasonal comparison built on that grid is then wrong, even though the printed total is right.
| What changes | How it appears | Why a check fails |
|---|---|---|
| Column structure | 12 months plus total; sometimes a stub month or a YTD column | Total counted as a month, or a partial period treated as full |
| Account names | "Turnover", "make ready" and "unit prep" on three statements | The same cost maps to three rows, so no line compares across properties |
| Sign convention | Vacancy as a negative; some expense credits in parentheses | A stripped minus turns a credit into a cost, and NOI moves in the wrong direction |
| Accounting basis | Cash or accrual, rarely stated on the page | Taxes paid twice a year and insurance paid once look like spikes or omissions |
| Recovery presentation | Utility reimbursements as other income, or netted against utility expense | NOI can match while income and expense totals do not |
The recovery example is worth the arithmetic. Suppose a property collects $36,000 of utility reimbursements against $90,000 of owner-paid utility cost. Book the reimbursements as other income against the full $90,000 expense, and effective gross income and operating expenses both include the $36,000. Net them against the utility line instead, and both totals fall by $36,000. NOI is identical either way. Expense ratio, expense per unit and every comparison against a property that presents the other way are now wrong by the amount of the recovery. Two property managers can both be internally consistent and still produce statements you cannot compare.
The same document also hides timing. Property taxes may appear in two months and insurance in one. A roof replacement may sit in repairs and maintenance in March, larger than the other eleven months combined. Read the annual total and the property looks stable. Read the columns and you know which month to ask about.
This is the part practitioners describe in their own words. "Manual rent roll + T12 entry eats hours and it's super easy to make mistakes, especially when PDFs are messy" (r/RealEstateDevelopment, 2026). The complaint is about structure: it has to be rebuilt before the numbers mean anything.
The most useful column on a T12 is the one that shows when something happened. The annual total is a summary of a year you cannot see.
Five Checks Catch Most of What Breaks a T12
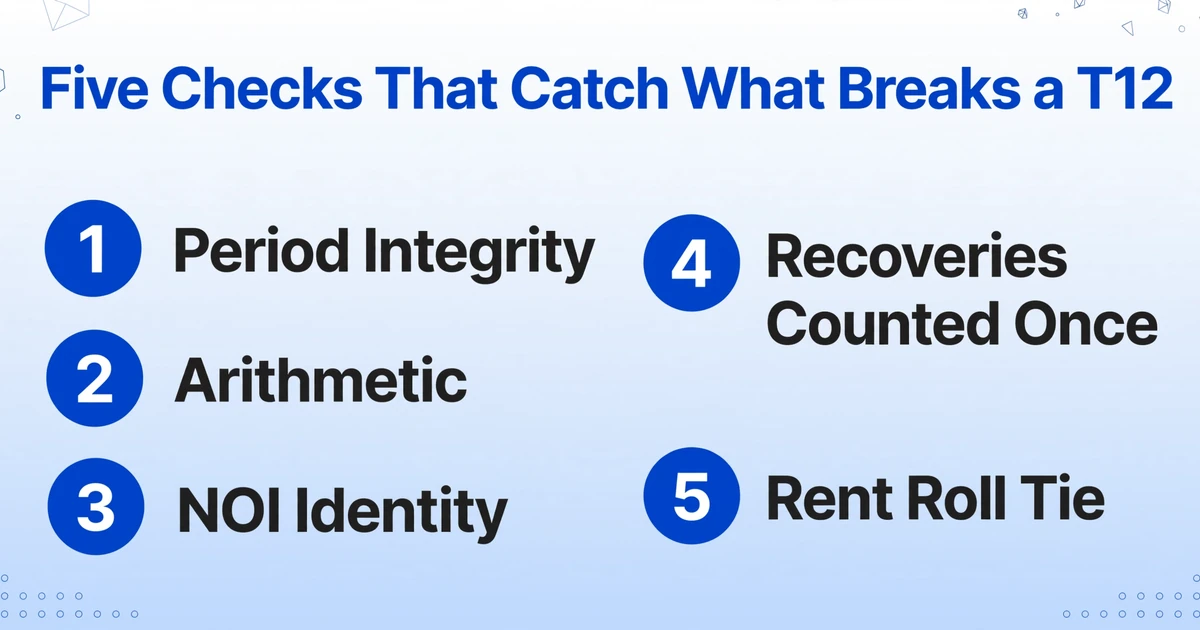
Before a number reaches a model, the statement has to prove four things about itself and one thing against the rent roll. Each check is mechanical. None of them requires you to decide whether the property is a good investment.
Period integrity
Twelve distinct, consecutive, complete months, with an end date. A nine-month statement is a nine-month statement. It is not a T12, and multiplying it by 12 produces a forecast with no evidence behind it. Confirm that no budget or reforecast column has been left inside the actuals.
Arithmetic
Each row's twelve months should sum to that row's total, and each section subtotal should equal its lines. This is the check that catches a total column counted as a month, a duplicated month, or a line that was retyped with one digit wrong. It is also the cheapest check to run.
NOI identity
Effective gross income minus total operating expenses should equal the NOI printed on the page. If it does not, the difference is the finding. Check what sits above the line: debt service, capital expenditure, depreciation and income taxes belong below it. A roof replacement booked to repairs is an operating expense as printed, and a normalization question for later.
Recoveries counted once
A reimbursement can be income with a gross expense, or a credit against the expense. It cannot be both. If you add reimbursement income and also deduct an expense that has already been reduced by the same money, NOI is overstated by the recovery. Pick the presentation the lender requires and apply it to every property in the comparison.
Rent roll tie
Annualized in-place rent against collected rental income, with the gap decomposed into vacancy, concessions, bad debt, loss to lease, rent changes and timing. A gap that survives decomposition is a question for the seller. A property that reports 95% occupancy while collecting 89% of scheduled rent is telling you two different things.
A lender does not stop at these five. CMBS servicers normalize a borrower's statement into standard reporting categories and record every adjustment on an NOI Adjustment Worksheet, so the NOI that reaches an investor can be traced back to the borrower's line items (CREFC Investor Reporting Package). The lesson for anyone extracting a T12 is that the printed NOI is an input, and the adjustments are a separate record you have to keep.
A Usable Table Keeps the Line, the Month and the Source
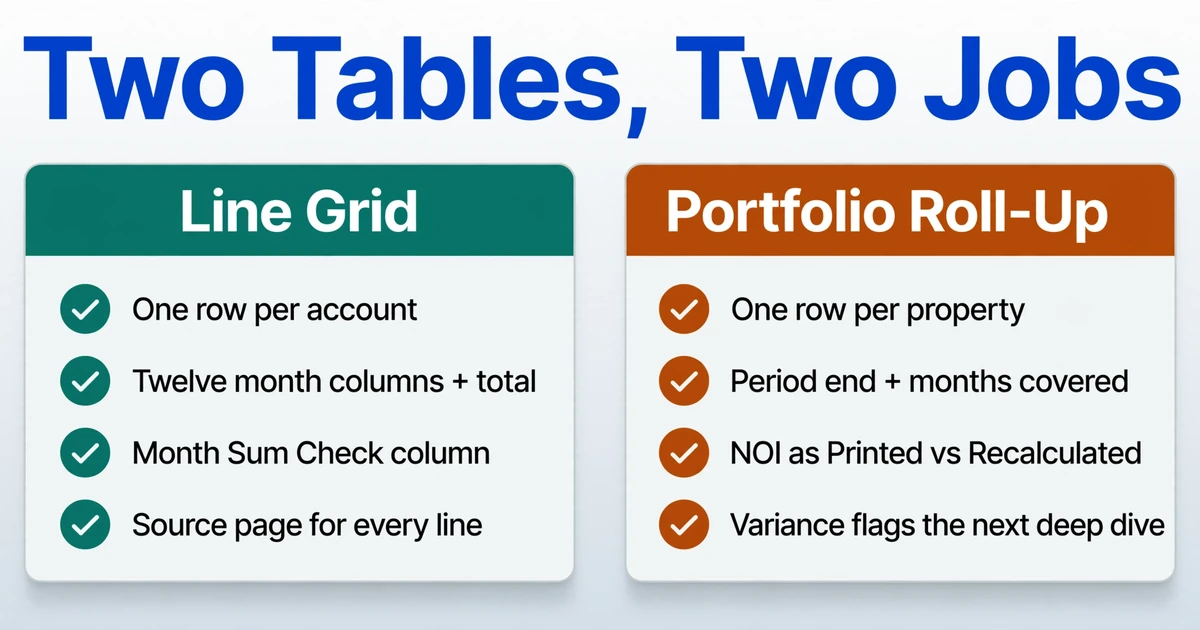
The output that survives review is a grid with one row per account, twelve month columns, a total, and a check column that recomputes the total. A summary row per property is where the evidence disappears.
Two tables are worth building, and they serve different moments. For a live deal, build the line grid: Line Item, Section, Jan 2026 through Dec 2026, Total as Printed, Month Sum Check, Source Page. For portfolio triage across twenty properties, build the roll-up: Property, Period End, Months Covered, Effective Gross Income, Operating Expenses, NOI as Printed, NOI Recalculated, Variance. The first lets you defend a number. The second tells you which property deserves the first.
ImageToTable.ai works through Custom Column Extraction: you type the column names you want, and the AI locates each value on the page by understanding what the label means rather than where it sits. Your column names become the headers of the output table. For a T12 that means naming the months and the lines you need, not accepting whatever grid the PDF happens to draw.
The check columns are where the tool does more than copy. Computed columns perform arithmetic on extracted values and output the result as a new column. Name one Month Sum Check (Jan + Feb + Mar + Apr + May + Jun + Jul + Aug + Sep + Oct + Nov + Dec - Total) and every row returns either OK or the difference. Name another NOI Check (Effective Gross Income - Total Operating Expenses - NOI as Printed) and the statement's own identity becomes a column you can filter.
Conditional logic is supported, so a check can output "OK" when the totals match and the difference when they do not. The same mechanism can sum a section: add every expense line and compare it with the printed total operating expenses.
The pass itself is short. Upload the statement, name the columns above, and let the check columns do the arithmetic. On the first file, open Review Mode on the NOI line and confirm the three or four cells that feed it. Once the column set is right, apply it to the rest of the batch instead of rebuilding the table for every property.
Batch processing is what makes the portfolio view practical. Forty T12s go in as one upload and come out as one table. That does not compare the properties for you, and it should not. It puts them in one sheet where a comparison is possible, which is the step that used to be manual.
Dense statements are exactly where verification stops being optional. Review Mode with Bbox linking lets you hover a cell and see the region of the original page it came from, or click a region on the page and jump back to the cell. On a T12 the same digits repeat across twelve columns, so a visual check is faster than rereading the row. If a statement is an older scan, or the columns are cramped, the higher Model Tier uses a stronger vision model for the same job.
Keep the arithmetic in perspective. At the 99% ceiling published for printed tables, a 60-line statement with 13 numeric columns is about 780 values, and roughly eight of them would be wrong. That is why every row needs a check column and a source link: the errors that matter are the ones that still look reasonable.
The mapping decisions still belong to the analyst. If the distinction between moving numbers and mapping them is new to you, financial statement spreading covers the policy layer that sits on top of this one. If you are choosing between tools rather than reading a statement, the comparison of document extraction tools for property management covers what each one does with a T12 or a rent roll.
Normalization Is a Judgment the Statement Does Not Contain
A T12 records where a cost was booked; it does not say whether that booking is right for the next owner. Extraction can move the line and prove the arithmetic. The decisions in this section stay with a person, and the honest version of any T12 workflow says so.
A $180,000 roof replacement inside repairs and maintenance is either an operating cost or a capital item. The statement shows which line it hit, not what the work was. The invoice and the accounting policy decide. A property tax bill reflects the seller's assessment, and a sale can reset it. Insurance shows the premium that was paid, not the quote the next owner will receive. A self-managed property may show no management fee at all, while a buyer will pay one from the first month.
Loss to lease and market rent are not on the T12. They come from the rent roll and the market. Whether NOI is stated before or after replacement reserves depends on the preparer, and the page may not say. The tool does not build the underwriting model or the pro forma, run a discounted cash flow, or reach a value. A cap rate applied to any of these numbers is a valuation decision, with comps and market assumptions behind it, and no extraction tool makes it.
Extraction can prove that a statement foots. It cannot prove that the NOI on it is the NOI you should underwrite.
FAQ
What is a T12 in real estate?
A T12 in real estate is a property's operating statement for the most recent twelve months, shown month by month and ending at net operating income. The period rolls with the calendar, so a statement dated September 2026 runs from October 2025 through September 2026. Buyers, lenders and appraisers use it as the record of what the property actually earned and spent.
Is a T12 the same as an operating statement?
A T12 is one kind of operating statement, defined by its period: the trailing twelve months ending on a stated date. An operating statement can also cover a month, a calendar year, a year to date, or a budget period. The label matters, because an operating statement with nine columns is not a T12 and should not be annualized as one.
What is the difference between a T12 and a T3?
A T3 covers the last three months and a T6 the last six. Shorter windows make a recent change easier to see, and they are more easily distorted by seasonality, a single repair or a tax installment. Annualizing a T3 is a forecast, not a substitute for twelve months of history.
Does a T12 include debt service?
Normally it does not. Debt service sits below NOI, because NOI measures the property before financing. Lenders test NOI against debt service through the debt service coverage ratio, which only works if the loan payment is kept out of the numerator. If a statement includes debt service in operating expenses, move it below the line before comparing anything.
Can I compare NOI across two properties' T12s?
Only after the periods, accounting basis, recovery presentation, management fee and reserve treatment are aligned. Two statements can report the same NOI while one books $36,000 of utility recoveries as income and the other nets them against expense. The NOI agrees and the expense ratio does not. Comparable NOI is a constructed number, not a printed one.
Can AI extract a scanned or photographed T12?
It can when the pages are legible and the table structure is visible. Scans of old statements, faint carbon copies and photographs taken at an angle are harder, which is what the higher processing tier is for. Check the monthly grid against the printed total before trusting any row, and use the source link for the cells that feed your model.
How current should a T12 be?
It should end at the most recent closed month. A statement that stops three or four months before closing leaves the period that matters most unreported. Ask for the missing months in the same format, and do not assume the trend from the earlier part of the year continued.
A single annual NOI is a claim. Twelve dated columns, a label on every line and a page reference behind every value are evidence, and evidence is what survives a credit committee, a partner meeting or a lender's questions. The work worth automating is the part that keeps all three attached.