Add Screenshot Data to Google Sheets
No Code, Keep Your Workflow
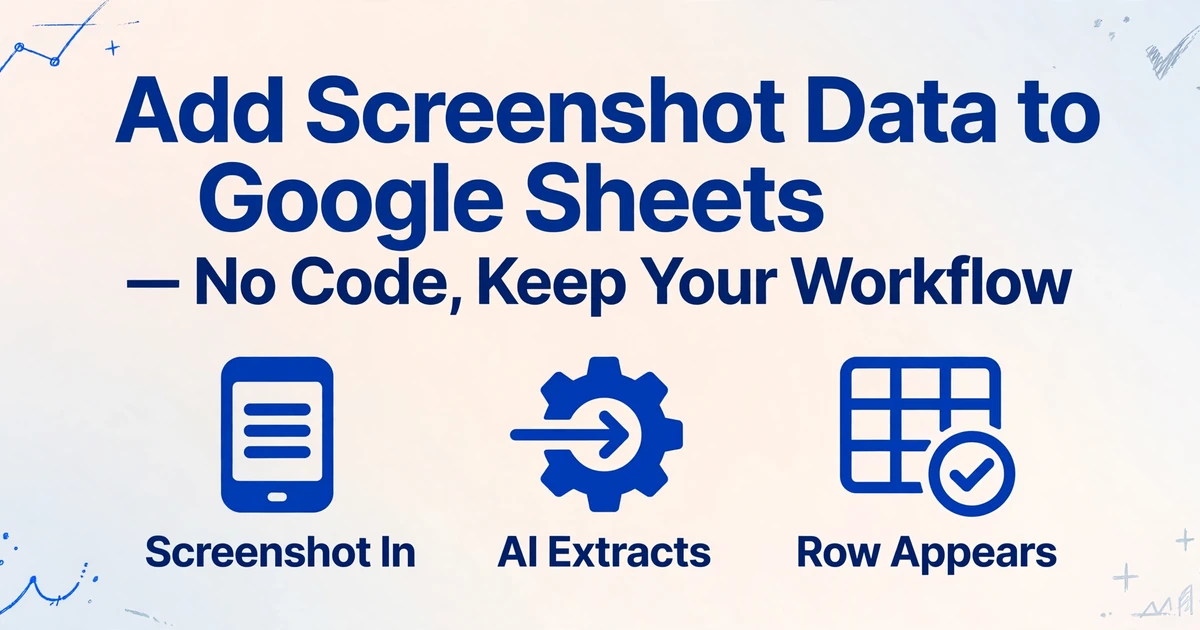
If your Google Sheets already uses IMPORTDATA to pull live CSV feeds, QUERY to filter rows into per-client tabs, and a pivot table that feeds a dashboard your team refreshes daily — you have a pipeline. It works. The problem isn't that it's broken. The problem is that it has a blind spot: it cannot read images. Every screenshot that holds data you need — a Stripe confirmation, a supplier portal order status, an internal dashboard KPI — hits a wall at the edge of your pipeline, and someone types it in manually. Adding screenshot extraction does not mean rebuilding that pipeline. It means closing the gap at one specific insertion point, leaving everything downstream untouched.
Key Takeaways
- Three thousand screenshots means three thousand manual re-typing sessions — not because your Google Sheets pipeline is broken, but because IMPORTDATA pulls CSV feeds yet no native function can decode an image, leaving every payment confirmation and dashboard capture to be typed in by hand.
- Every formula, pivot table, shared dashboard link, and permission setting stays completely intact when you add screenshot extraction — because formulas bind to column headers and positions, not to data origins, so your VLOOKUP and SUMIFS never need to know the source was a screenshot rather than a CSV import.
- ImageToTable.ai slots into your pipeline through a column-name handshake — define extraction fields matching your existing spreadsheet headers, feed the output into QUERY and pivot tables like any import, and verify nothing breaks by picking just 3 screenshots from your backlog.
Where the gap actually sits
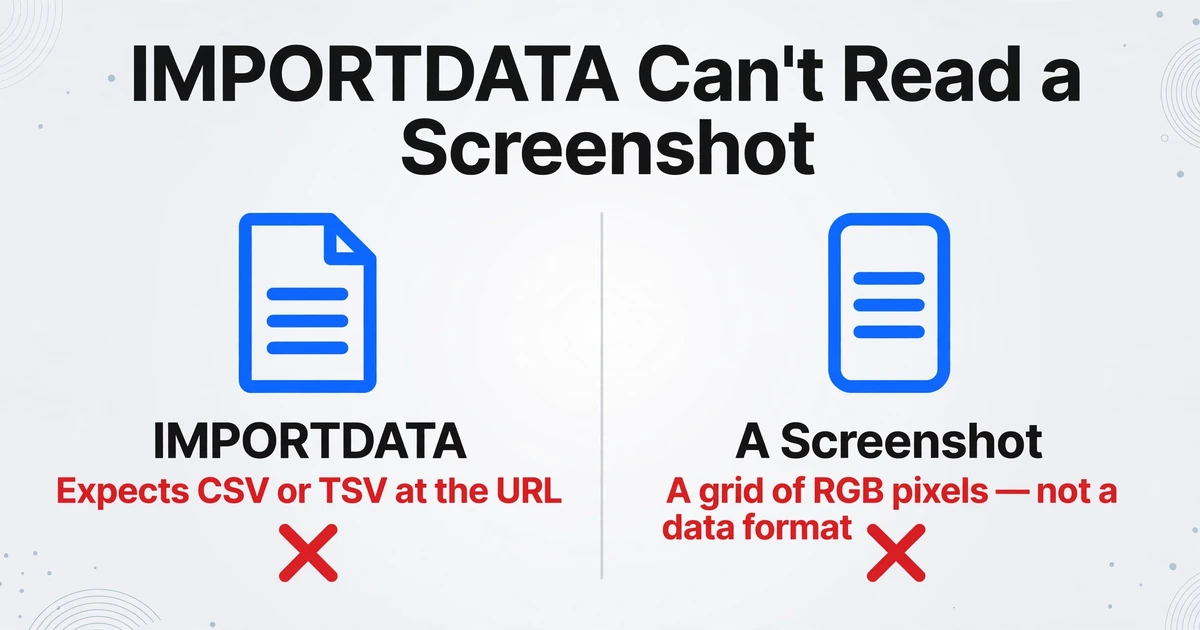
Most discussions about screenshot data pipelines focus on the wrong step. They ask: "how do I collect screenshots?" or "how do I store them?" But by the time someone searches for "screenshot data pipeline Google Sheets," the collection step is already solved. The screenshots are already in a folder, a Slack channel, a WhatsApp thread, or an inbox. The real gap sits between the screenshot existing and that screenshot becoming a row in a spreadsheet. That gap — the extraction step — is what Google Sheets' native import functions cannot cross.
Sheets has IMPORTDATA for CSV/TSV URLs, IMPORTHTML for tables inside web pages, IMPORTFEED for RSS, and IMPORTRANGE to pull from other spreadsheets. Each of these expects structured, machine-readable input at the other end of the URL. A screenshot — a grid of RGB pixels rendered by a screen — is none of those things. It is the output of a display pipeline, not a data format. As one Reddit user in r/excel put it bluntly: "i have screenshots of client data with name, email, phone number, registration date and last booking. is there a way to batch import these into an excel file?" The answer with native Google Sheets functions alone is no — IMPORTDATA cannot decode an image. The answer with the right tool inserted at the right point is yes, without touching anything else in the sheet.
The problem compounds with volume. One Reddit user in r/ChatGPT described processing 600 screenshots from a mobile app, each containing structured fields like Tag Number, Weight, GPS coordinates, and Date — and found that uploading batches of 10 into ChatGPT worked but hit upload limits quickly. Another user in r/dataengineering faced 3,000 screenshots with 100 leads each. These are not unusual. They are what happens when the screenshot-to-spreadsheet gap goes unclosed.
A study cited across multiple data integration platforms noted that 90% of data entry and extraction tasks are still performed manually. That number, applied to the screenshot-to-Sheet gap, translates to a substantial amount of re-typing work embedded inside otherwise automated environments. Plugging the extraction step into the pipeline eliminates that re-typing without altering anything else.
Core insight
The extraction gap is between "screenshot captured" and "data in Sheets." Fill it at one insertion point. Everything upstream (how you get screenshots) and downstream (what you do with the data) stays exactly as it is.
What your existing Google Sheets pipeline already does — and doesn't need to change
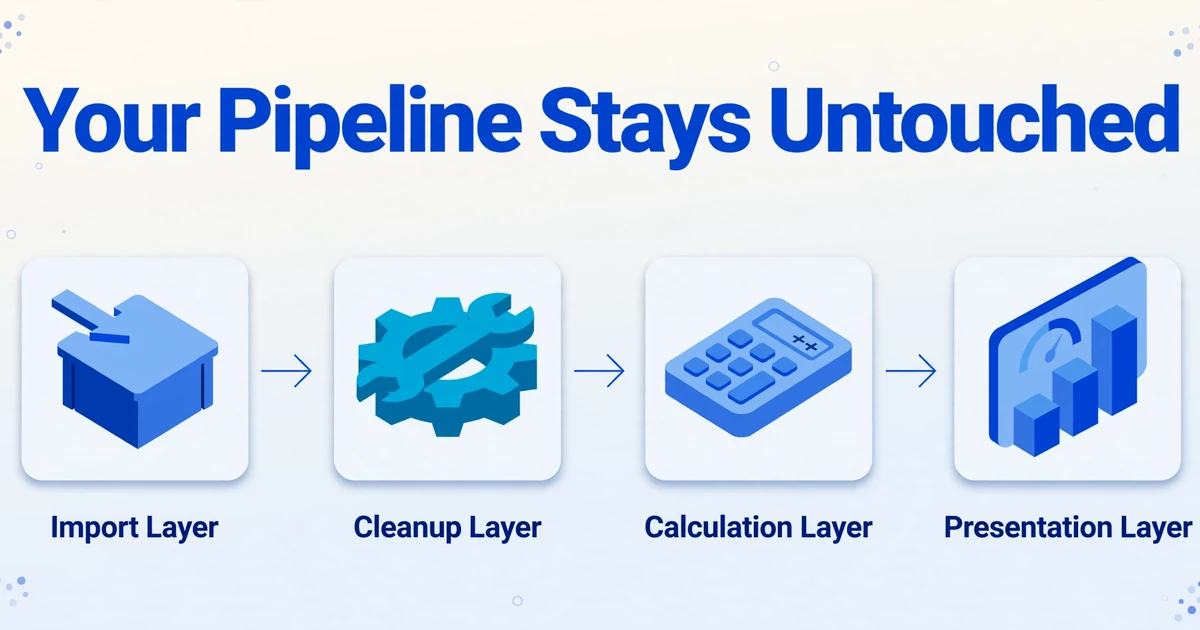
Before adding anything new, the most useful exercise is cataloging what you already have. A typical operations spreadsheet built over months or years contains layers that accumulate in a specific dependency order:
- Import layer:
IMPORTRANGEpulling data from other workbooks,QUERY+IMPORTDATAfetching live external feeds, or manual CSV imports from accounting software exports. - Cleanup layer:
ARRAYFORMULAstandardizing date formats,IFERRORguarding against missing imports, custom formatting rules applied to entire columns. - Calculation layer:
VLOOKUPandINDEX/MATCHcross-referencing sheets,SUMIFSaggregating by category or period, pivot tables summarizing transaction data. - Presentation layer: Charts linked to ranges, conditional formatting on thresholds, dashboard tabs shared with stakeholders via "Anyone with the link" permissions.
The extraction step — the one you are adding — slots above the import layer. It converts screenshots into structured data (XLSX or CSV), which then enters the import layer just like any other data source your pipeline already handles. The cleanup, calculation, and presentation layers never need to know that the data originated from a screenshot rather than a CSV export or an API feed.
This is the central promise of the workflow integration approach: the new step produces output in a format your existing pipeline already consumes. No VLOOKUP needs rewriting. No pivot table range needs redefining. No shared dashboard link breaks. The pipeline does not care where the data came from — it only cares that it arrives formatted consistently with column headers that match the rest of the workflow.
The two insertion points — and which one fits your workflow
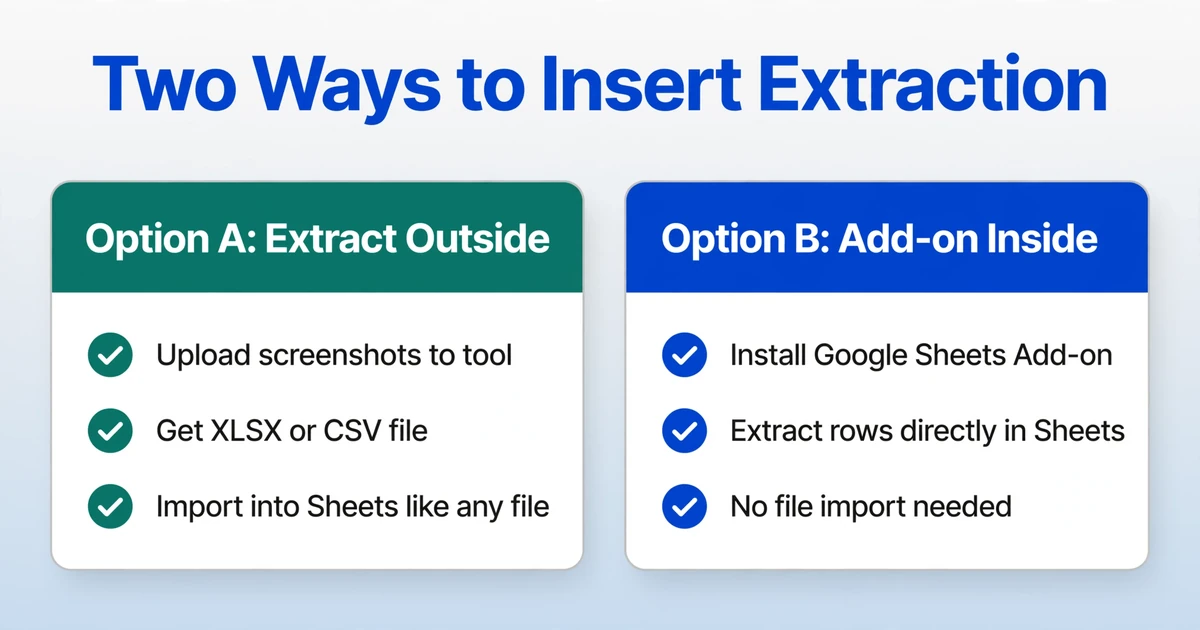
There are exactly two places where screenshot extraction can connect to a Google Sheets pipeline. Neither requires code. Neither requires rebuilding your spreadsheet. The choice between them depends on how frequently you process screenshots and whether you prefer working inside Sheets or outside it.
Option A: Extract outside Sheets, import the output
This is the path that changes the least. You use an AI extraction tool to process screenshots into a structured file — XLSX or CSV — and then bring that file into Sheets the same way you bring in any other external data.
The workflow:
- Upload screenshots to the extraction tool — a single file or a batch of dozens or hundreds. The tool's AI reads each image using a visual language model that understands text, numbers, and their relationships on screen — not by detecting table borders, but by recognizing what each piece of data means based on the field names you specify.
- Define the column names you want extracted — these become the exact column headers in your output. For payment screenshots, you might enter:
Date | Amount | Sender | Reference Number | Payment Method. For dashboard captures:KPI Name | Current Value | Previous Period | Change %. The columns adapt to whatever your screenshots contain. - Review the extracted table — fields with low confidence are flagged for quick scanning. The review step typically takes seconds per row. For well-lit, high-resolution screenshots of clearly labeled data, accuracy reaches up to 99% for printed text.
- Download as XLSX or CSV, then import into Sheets via File → Import, or place the file in a Google Drive folder watched by your
IMPORTDATAformula.
What doesn't change: Your sheet structure. Your formulas. Your charts. Your sharing permissions. The extraction step produces output that feeds into the import layer — the same layer that already handles your other data sources. From the sheet's perspective, this is just another file import.
Best for: Periodic batch processing — weekly dashboard screenshots, monthly supplier portal extractions, quarterly report data pulls. If you process screenshots in bursts rather than throughout the day, this path keeps the tool outside Sheets and the pipeline clean.
Option B: Extract directly inside Sheets with an add-on
If Google Sheets is your primary workspace and you handle screenshots frequently throughout the day, an add-on that runs inside Sheets eliminates the download-and-re-import loop. You upload images or PDFs from a sidebar without leaving the spreadsheet, specify column names, and the extracted data appends directly into the active sheet.
ImageToTable.ai provides a Google Sheets add-on that does exactly this: a sidebar panel accessible from any sheet where you select screenshots, define extraction columns, and click to get structured rows written into your current tab. The add-on connects through an API key tied to your account — usage counts against your plan quota, and it syncs with your website history and saved column templates. For the full capability rundown — supported field types, formats, and plan details — see the Google Sheets extraction capability guide.
What doesn't change: You stay in Sheets. The data arrives as typed cells — dates as dates, amounts as numbers — not as a floating image object. Your downstream formulas pick it up automatically because the output lands in the column positions they expect. If you already have a pipeline where new rows are appended at the bottom of a data sheet and QUERY/FILTER functions feed from there, the add-on works with exactly that pattern.
Best for: Frequent, ad-hoc extraction — customer support screenshots, daily payment confirmations, internal dashboard captures that need to join live analysis. If you are already spending significant time inside Sheets, this path adds the extraction step without adding a context switch.
Files are processed securely and not stored.
Both insertion points share one critical property: the column names you define during extraction become the column names in your output. If your existing pipeline expects a column called "Transaction Amount" in column C and a SUMIF references that header, you set "Transaction Amount" as the extraction field and the output drops in cleanly. This is what makes the integration feel seamless — the column names act as the handshake between the extraction step and everything downstream.
What changes — and what doesn't — in your daily routine
The resistance to adding any new step to an existing workflow is rarely about the step itself. It is about the unknown knock-on effects — the formatting issues, the formula breaks, the "I'll spend an hour fixing the hour of work this was supposed to save." Here is an honest inventory.
| Aspect | What changes | What stays the same |
|---|---|---|
| Sheet structure | Nothing — the output files or add-on rows match your existing column layout | Tabs, named ranges, protected ranges, data validation rules |
| Formulas | Nothing — VLOOKUP, QUERY, SUMIFS reference column headers and ranges that remain unchanged | All existing formulas, including ARRAYFORMULA spans |
| Charts & dashboards | Nothing — chart data ranges point to the same columns; new rows auto-expand if ranges are open-ended | All chart types, conditional formatting, dashboard layouts |
| Sharing & permissions | Nothing — the sheet file itself does not move or change ownership | All sharing settings, "Anyone with link" access, editor/viewer roles |
| Screenshot handling | Instead of re-typing data from screenshots, you upload (or use the add-on) and get structured output | How you capture screenshots (Snipping Tool, browser extensions, mobile share) does not change |
| Data review step | A new review step appears for low-confidence fields — takes seconds per row rather than minutes of re-typing | The data validation checks you already do (cross-referencing totals, checking date ranges) remain the same |
The takeaway from this inventory: the extraction step replaces typing, not analysis. Your existing pipeline — the layers you built to clean, transform, calculate, and present data — keeps working because it was built on column structure, not on how the data arrived. As long as extraction output uses the same column names and data types your pipeline expects, the pipeline does not know the difference.
There is one nuance worth flagging: consistency in field naming across batches matters. If you call a field "Amount" in one extraction batch and "Transaction Total" in another, the output tables will not merge cleanly in Sheets. Pick your field names once — matching whatever your downstream formulas reference — and use them consistently. This is not a tool limitation; it is the same naming discipline that any structured data pipeline requires, whether the source is a screenshot, a CSV export, or a webhook payload.
How automation tools fit at the edges
If you already use Zapier, Make, or n8n to connect Google Sheets with your other tools — "when a new row appears in Sheet A, create a task in Asana" or "when a Stripe payment succeeds, append a row to Sheet B" — the extraction step can sit inside that same automation fabric. The pattern is the same: one more node in the workflow graph, not a replacement of the graph.
Zapier connects over 9,000 apps with a visual trigger-action builder. If your screenshot collection happens via email, a Slack channel, or a watched folder, Zapier can route those files to an extraction step before the data lands in Sheets. The extraction tool processes the screenshots and outputs structured data — which Zapier then writes to your sheet using the "Create Spreadsheet Row" action. The column mapping between extraction output and Sheet columns is configured once.
n8n, an open-source alternative with over 30 dedicated Google Sheets modules, offers more granular control: you can monitor Sheets for changes, process data through external APIs, execute conditional branching, and even self-host the entire workflow for data that cannot leave your infrastructure. A common pattern: a watched Google Drive folder triggers extraction when new screenshots are added, the AI processes them, and n8n appends the results to the correct sheet — all without a single google.script.run call in Apps Script.
Google Apps Script itself remains a lightweight option for users comfortable with minimal scripting. You can write a script that watches a specific Gmail label for incoming screenshots, sends them to an extraction API, and writes the returned structured data into a designated sheet. The script handles the "fetch and route" part; the extraction tool handles the "read the image" part. Neither piece requires building a full pipeline from scratch.
The important pattern across all three approaches: the extraction step is one node in a graph that already exists. You are not building a new pipeline around the extraction tool. You are inserting extraction into a pipeline that already connects Sheets to other services. The trigger (Zapier's "New File in Folder," n8n's "Watch Google Drive," Apps Script's time-driven trigger) remains what it was. The action (writing to Sheets) remains what it was. The extraction node sits between them, invisible to everything upstream and downstream except for the structured data it produces.
Why screenshot extraction beats OCR at the pipeline insertion point
Traditional OCR reads characters. An AI extraction tool built on a visual language model reads meaning — it understands that "$249.00" next to "Total Due" is a payment amount, not just the characters "2," "4," "9," ".", "0," "0." This semantic understanding is what enables extraction from screenshots that contain no tables at all — just label-value pairs scattered across cards and panels, like a Stripe payment confirmation or a bank app transaction detail. OCR would dump every character on the page into one unstructured text block. AI extraction organizes it into the columns you defined, ready to feed into your SUMIFS and pivot tables without manual cleanup. For a deeper look at why input format matters, the comparison of screenshot vs. PDF vs. photo extraction accuracy explains which formats deliver the most reliable results.
Frequently Asked Questions
Does this work with screenshots that don't contain tables?
Yes — that is the primary use case. Most app screenshots (payment confirmations, banking details, CRM records) display data as label-value pairs across cards and panels, not as HTML-style tables. Column-name extraction reads these by understanding the relationship between a label — "Order Total," "Confirmation Number," "Payment Date" — and the value next to it, regardless of where they appear on screen. This is distinct from tools like Microsoft Excel's "Data from Picture," which detects table structures and requires the screenshot to contain a recognizable grid.
What happens to my existing IMPORTDATA and QUERY formulas?
Nothing. Extraction output arrives as a separate data source — either an imported XLSX/CSV file or rows appended by the add-on. Your IMPORTDATA formulas continue pulling their original CSV feeds. Your QUERY formulas continue filtering their original ranges. If you want the extracted data to feed into the same analysis, you point your formulas at the new columns or consolidate into a single data tab using QUERY({'Sheet1'!A:Z; 'ExtractedData'!A:Z}) — but this is an optional consolidation, not a required rebuild.
Can I process hundreds of screenshots at once into the same Google Sheet?
Yes. Batch processing works by uploading multiple screenshots in a single session and defining one set of column names. Each screenshot becomes one row in the output spreadsheet, with the columns you specified. For example, 200 app screenshots from a field data collection project become 200 rows in your sheet — each with "Location," "Reading," "Timestamp," and "Technician ID" filled from the corresponding screenshot. The batch processing guide covers the full workflow for volume operations.
Does the Google Sheets add-on require coding or Apps Script?
No. The add-on installs from the Google Workspace Marketplace and provides a sidebar interface inside any sheet. You connect it with an API key from your account, select screenshots for upload, define extraction columns in plain text (e.g., "Invoice Number, Date, Amount, Vendor"), and extracted rows appear in your sheet. No Apps Script, no UrlFetchApp calls, no deployment configuration.
How does extraction accuracy compare to manual data entry?
For printed text in well-lit, high-resolution screenshots, AI extraction accuracy reaches up to 99% — comparable to what a careful human typist achieves, but in 5–10 seconds per screenshot versus the approximately 3 minutes it takes to manually read and type the same fields. The difference is not primarily an accuracy improvement over careful manual entry — it is a speed improvement (roughly 18× faster) with equivalent accuracy. The review step catches low-confidence fields, flagged by the AI, which you can scan in seconds. For deep dives into what affects extraction consistency, the 6 common screenshot extraction mistakes covers resolution, cropping, and naming practices that make the difference between clean output and cleanup work.
If my screenshots contain sensitive financial or personal data, is processing secure?
Files are processed through the extraction session and not stored after completion. For regulated industries, review the processing terms against your organization's data handling requirements — particularly if screenshots contain PII, payment card data, or protected health information subject to HIPAA or GDPR. The tool itself processes data transiently; your responsibility is to confirm that the processing workflow fits your compliance obligations.
What's the difference between this and uploading screenshots into ChatGPT one batch at a time?
The fundamental difference is structure. ChatGPT returns text in paragraphs — you still need to manually reformat it into spreadsheet columns. An extraction tool built for this purpose returns structured data directly: each field you named becomes a column, each screenshot becomes a row, and nothing lands as a free-text paragraph you have to parse. This is the gap between "AI can read this image" and "AI can feed this image into my existing spreadsheet pipeline." One produces conversation. The other produces data your SUMIFS can use immediately.
Can I use this for the screenshots already sitting in my backlog?
Yes — and this is one of the highest-ROI starting points. The screenshot data backlog that accumulates in team folders, Slack threads, and email attachments represents data your team already collected and simply cannot use without manual extraction. Running the backlog through batch extraction converts sunk cost (the time spent capturing) into usable data, often in a single processing session. It is the fastest way to demonstrate to yourself that the insertion point works — because the downstream pipeline needs no modification, and the before/after is immediately visible: a folder of dead screenshots becomes a sheet of searchable, sortable, formula-ready data.
The test that takes 5 minutes
Pick 3 screenshots that contain data you've been meaning to get into a sheet. Define the column names you need. See if the extraction step produces structured rows while your formulas, charts, and shared links stay exactly as they are. If it works for 3, it works for 300.
Try it on your screenshots