How to Extract Only the
Data Fields You Need from Any Screenshot
What if the data you need from a screenshot is just two numbers — maybe "Net Revenue" and "Churn Rate" from a weekly metrics dashboard — but every tool you've tried hands you back the entire page? All 14 columns, 12 of which you'll delete before the data becomes useful. The question isn't how to get data out of a screenshot. There are dozens of ways to do that. The question is why you should have to extract everything just to keep the three fields that matter.
What "Extract Everything" Actually Costs You
Most screenshot extraction tools make the same quiet assumption: that you want all the data on the page. This assumption creates a cleanup step that nobody budgets for.
Take a dashboard screenshot with 18 KPI cards. You need three of them: MRR, Active Users, and Conversion Rate. Excel's built-in Data from Picture feature — the first tool most people reach for — extracts every visible number into cells. Now you have 55 data points across a web of rows and columns, most of them contextless values stripped from their labels. Before you can use the three you need, you have to locate each one among the 55, verify it's the right value (the "revenue" number from the North America card, not the global card), then delete or archive the rest.
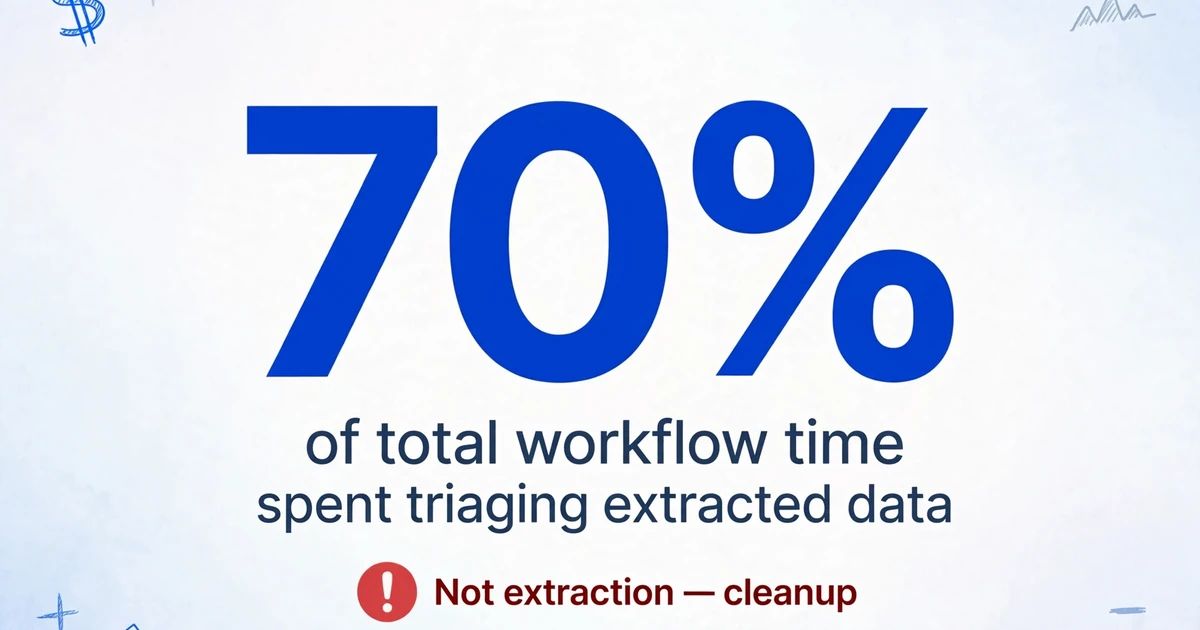
If you do this twice a week, the cleanup accounts for roughly 70% of your total workflow time. The extraction itself is fast. The triage is slow. Multiply that across a team of five people tracking metrics from different dashboards each week, and the invisible cost is 3-4 hours every Friday that nobody reports because nobody thinks of it as a separate task — it's just "getting the data into Excel."
A Reddit user working with 600 screenshots from a field data collection app put it plainly: they needed "Tag Number, Length, Weight, Event Type, Tagger, Date, Time, GPS/Location, Water Temperature" from each image. Uploading 10 at a time to ChatGPT worked, but hit upload limits fast. OCR tools gave them text back — but "don't always preserve field structure or link both screenshots from a record together." The gap in both approaches was the same: the tool gave them everything, and they had to rebuild the structure themselves.
The hidden cost of "extract everything" isn't processing time — it's the manual column deletion and re-verification that turns a 10-second extraction into a 3-minute per-screenshot task.
How Column-Based Extraction Selects Fields Instead of Transcribing Pages
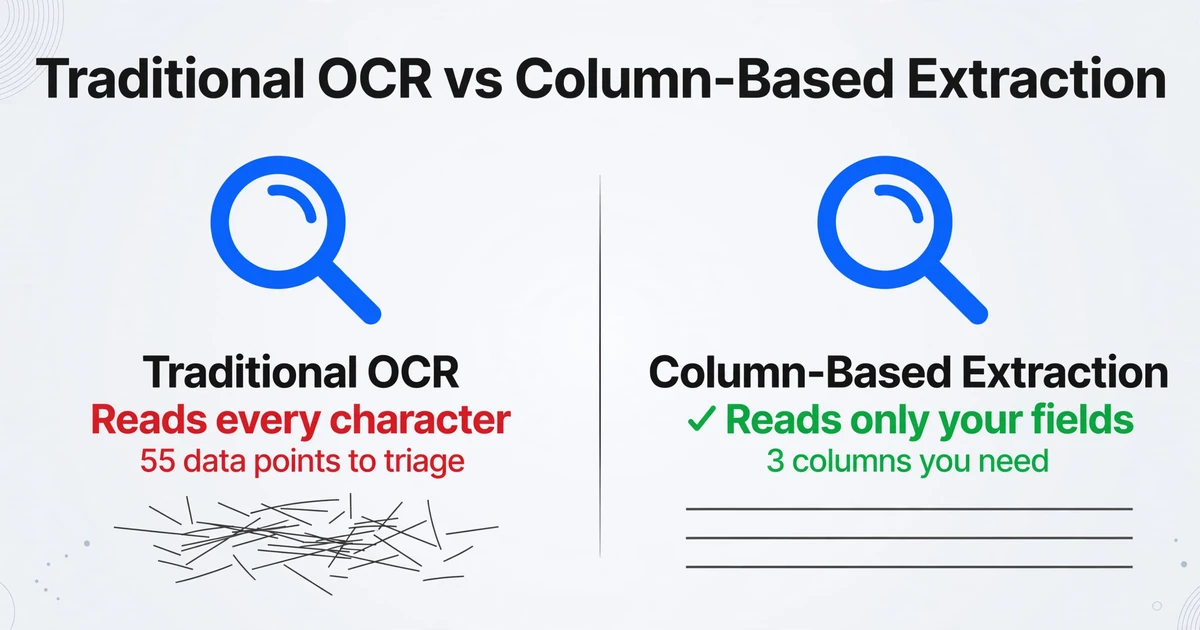
The reason most tools give you the entire page is architectural. Traditional OCR — whether it's Tesseract, Google Cloud Vision, or Microsoft's own engine behind Excel's Data from Picture — works by scanning an image left to right, top to bottom, converting every visible character into text. It can recognize that text falls into rows and columns if a table structure is present, but it has no mechanism for distinguishing which rows or columns you care about. It reads everything because it was designed for a different era of document processing — scanning entire pages of printed documents where reading everything was the whole point.
Selective field extraction starts from the opposite end. Instead of asking "what text is in this image," you ask "what values does this image contain for the field names I've defined." This is custom column extraction: you type the column names you want — "Revenue", "Churn Rate", "Active Users" — and the AI finds those values anywhere on the page based on what they mean, not where they sit. The column names you enter become the exact headers of your output table. Each value lands in the right column because the AI understands the semantic relationship between your label and the data on the screen, not because it memorized a pixel coordinate.
A 2025 independent benchmark by Pragmile tested 10 OCR and document understanding tools across six dimensions including table extraction quality. The gap was revealing: Tesseract scored 2/10 on table extraction — it "treated tables as continuous text without division into columns and rows." Even Azure Form Recognizer, which scored 10/10 on raw character OCR, dropped to 4/10 on table extraction. AI engines that understand document semantics, not just character shapes, are the ones that preserve meaningful structure.
Step-by-Step: Extracting Only the Fields You Want
You can run selective extraction without writing any code, configuring any templates, or training any model. The workflow has three steps, and the most important one happens before you touch a file.
Decide what you need before you open the tool. This is the step most people skip, and it's why they end up with 20 columns instead of 4. Look at your screenshot and write down the exact field names you want extracted — not "data from the top right" but "Monthly Active Users" and "Customer Acquisition Cost." If you're processing multiple screenshots with different layouts but the same data points (a common scenario when pulling metrics from different dashboards weekly), the same column names will work across all of them because the AI reads meaning, not position. This is what lets you consolidate screenshot data into one structured Excel file instead of creating a separate process per source.
Enter your column names and upload. Type your field names as column headers — "Timestamp," "Metric Name," "Value," "Source Dashboard." Upload your screenshot (or multiple screenshots — batch processing writes all results to the same table, merging rows from different images into one spreadsheet). The AI reads each image and fills the rows with values that correspond to each column name. If a particular screenshot doesn't contain a field you named, that cell stays empty rather than forcing a wrong value — a behavior that's safer than OCR tools that hallucinate text into blank spaces.
Export and verify. Download your structured output as Excel, CSV, or JSON. The verification step should be fast because you're only checking the fields you asked for — not scanning a 50-cell extract to confirm nothing got scrambled. If a value looks off, it's easier to spot in a 4-column table than a 20-column one. This is the "selective" advantage compounding: fewer fields to extract means fewer fields to verify, fewer errors to catch, and faster completion from upload to usable output.
Files are processed securely and not stored.
How to Name Your Fields for Cleanest Results
The quality of your output depends more on how you name your columns than on the resolution of your screenshot. This is the step where most people's extraction results either come out clean on the first try or require a second pass.
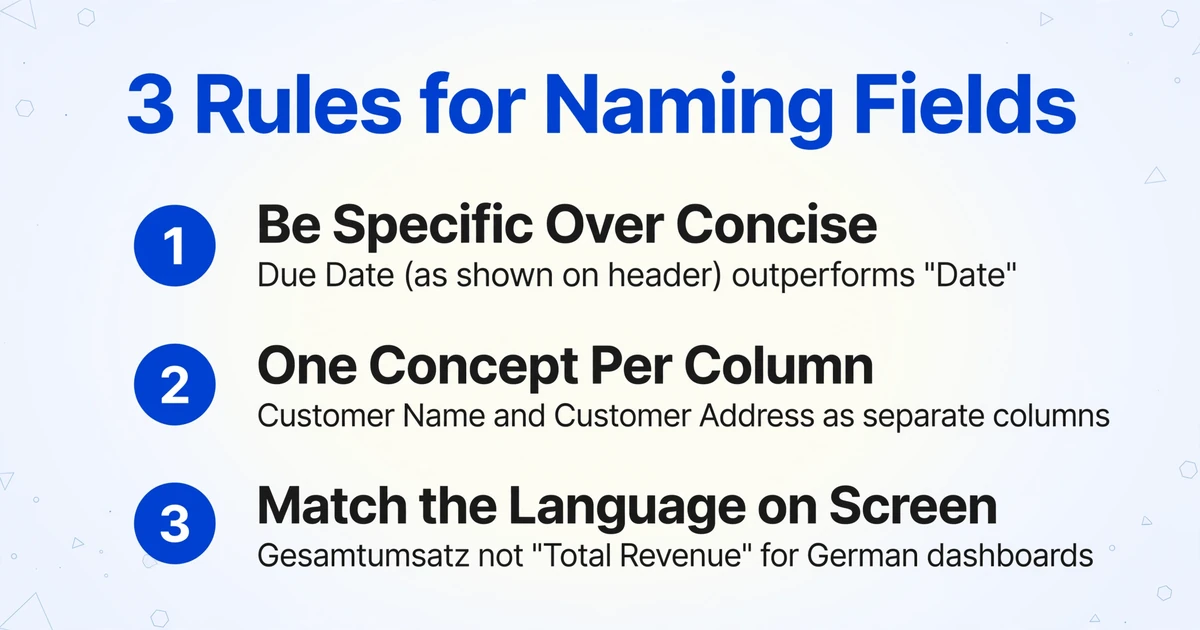
When you write "Amount" as a column name, the AI has to guess — is this the invoice total, the line item amount, the tax amount, or the subtotal? When you write "Invoice Total (incl. tax, in USD)," the AI has a specific target. More words in your column name give the model more context to disambiguate. This isn't about being verbose — it's about removing the guesswork from the semantic matching process. Here are three naming rules that produce consistently cleaner results:
Be specific over being concise. "Due Date (as shown on document header)" outperforms "Date." "Vendor Contact Email" outperforms "Email." If your screenshot comes from an app where "Total" might mean daily total, weekly total, or session total, include that distinction in the column name.
One concept per column. "Customer Name and Address" in a single column produces unpredictable results because the AI has to decide whether to concatenate them, pick one, or split across rows. Split into "Customer Name" and "Customer Address" as separate columns.
Match the language on the screenshot. If your dashboard is in German and labels say "Gesamtumsatz," name your column "Gesamtumsatz" not "Total Revenue." The AI can work across languages, but it anchors more confidently to the exact language and phrasing used in the image. This principle also applies across different software platforms — a value labelled "Net Sales" in Salesforce and "Revenue (net)" in Tableau will both map correctly to a column named "Net Sales" because the AI understands the semantic equivalence, but the match is more reliable when your naming convention is internally consistent across your extraction tasks.
Where Selective Extraction Excels — and Where It Doesn't
Selective extraction solves a specific problem extremely well, but it's not the best tool for every screenshot scenario. Knowing the boundary prevents frustration.
Where it clearly wins: Dashboard snapshots where you need 3 metrics out of 25. App screenshots where you're collecting the same set of fields from hundreds of records — like this Reddit user who needed to batch-import client name, email, phone, registration date, and last booking from screenshots into Excel. Cross-platform data consolidation — pulling the same KPI from a Salesforce screenshot, a Tableau screenshot, and a Google Analytics screenshot into one row, which is impossible with template-based tools that expect identical layouts. This is where the screenshot-to-spreadsheet approach moves from manual data entry to automated pipeline.
Where full-page OCR is the better choice: When you don't yet know what fields exist in the screenshot — you need to discover what's there before you can decide what to extract. When you're archiving a screenshot's contents verbatim for compliance or audit purposes, where completeness matters more than usability. When the screenshot contains a single dense table where you genuinely do want all columns, and verifying 20 columns is still faster than manually transcribing them.
This isn't a binary choice. The most efficient workflows often use both: a quick full extraction to survey what's in a new document type, then a selective extraction template for the repeat runs. The setup cost of defining columns only has to be paid once; every subsequent extraction with those same columns is near-instant.
Frequently Asked Questions
Does selective extraction work on screenshots that aren't tables — like dashboards with scattered widgets?
Yes, and this is where it creates the largest efficiency gain over traditional OCR. Template-based tools break when data isn't in a neat grid. Selective extraction using column-name matching doesn't need a grid — it finds the value "Monthly Active Users: 142,300" whether that text sits in the top-left KPI card, a center bar chart label, or a footer summary. The position is irrelevant to the AI; only the semantic match between your column name and the screenshot content matters.
What happens if a screenshot doesn't contain one of the fields I named?
The cell stays blank for that row. This is deliberate behavior. Forcing a guessed value into an empty cell is worse than leaving it blank — a blank cell tells you "this screenshot didn't have that data," while a guessed value looks correct and leads to downstream errors that are much harder to catch. If you're processing a batch of screenshots where some contain all fields and others are partial, you'll see gaps where expected — which is exactly what you want for honest auditing.
Can I use the same set of column names across different types of screenshots?
Yes, and that's the core workflow advantage. If you define columns "Metric Name," "This Week Value," "Last Week Value," and "Change %" once, you can upload a Salesforce dashboard screenshot, a Google Analytics screenshot, and an internal BI tool screenshot in the same batch — the AI maps semantically equivalent values to the right columns regardless of source format. The only requirement is that your column names are specific enough to avoid ambiguity (see the naming section above). For more complex multi-source scenarios, a few extra words in your column names prevent most mismatches.
Does this work with screenshots containing handwriting or annotations?
Yes, within limits. Handwritten numbers and short handwritten labels are generally recognized well. Longer handwritten notes, cursive script on low-contrast backgrounds, or annotations overlapping with printed text will have lower accuracy. For screenshots that mix printed data with handwritten margin notes, extraction of the printed content remains highly reliable — the handwriting adds noise but doesn't corrupt the structured portions of the output.
How many fields can I extract from one screenshot?
There's no hard limit — you can define as many column names as you need. But in practice, defining more fields increases the chance of mismatches (two columns named "Amount" and "Amount (USD)" might capture overlapping values). The sweet spot for cleanest output is 5-15 clearly distinct fields. If you genuinely need 40 fields from a dense document, consider running two separate extraction passes with different column sets — it adds a merge step but keeps each pass's output cleaner.
You don't need to learn OCR configuration. You don't need to train a model on sample layouts. You need to know what you want to extract, and name those things precisely. Everything else is the tool's problem, not yours.
Try selective extraction on your next screenshot. Define your columns and upload — your output table will only contain the fields you asked for.