Which Reading in the Batch Is Wrong?
Utility usage has a history. Anomalies break their own.
Every number on a reading sheet is individually correct. The meter showed 412, the clerk transcribed 412, and the photo matches. One of those correct numbers is still hiding a toilet that runs all night, a service whose register was reset by a meter swap, or a circuit that draws power with nobody home. The anomaly is not a bad reading. It is a reading that breaks that meter's own history, and a human scanning 150 rows top to bottom will not reliably find it.
Key Takeaways
- The anomaly is hidden by the sheet, not by your eyes, because no column compares a reading to its own meter's past.
- Three people touch every reading, so a skipped meter, a swapped register or a wrong-cycle paste can break that history before anyone notices.
- Build usage, per-day use and a 150% history flag as columns the extraction fills in, and the review shrinks to one sort plus visits to the few meters that broke their own history.
The scale of what hides in normal-looking readings is well documented on both sides of the meter. Globally, electricity theft and meter tampering, what the industry calls non-technical losses (energy that is delivered but never billed), was estimated at about $89.3 billion a year in ongoing academic accounting (ASEE Proceedings, Understanding Electricity Theft). Water utilities lose the other direction: Bluefield Research puts U.S. non-revenue water, treated water that never reaches a paying customer, at about 19.5% of supply and $6.4 billion in uncaptured revenue a year, with small utilities losing more than 20% of every gallon they treat (Bluefield Research). None of that shows up as a single dramatic number on a reading sheet. It shows up as a meter whose month looks different from its own months.
An anomaly is not a bad reading. It is a reading that breaks that meter's own history, and the comparison to that history is a column you can build.
That is where the existing content on this topic stops. Nearly every article in the AI-meter-reading space, including our own complete guide to meter reading extraction, ends the moment a number comes out of a photo. This article covers the step after that: the readings are in one sheet, from one route, and you need the rows that break their own history to surface before a bill dispute, a leak damages a building, or months of theft go unnoticed. The sibling piece on comparing bulk meter readings across periods covers who should do the comparison and why it so rarely happens; here we go one level deeper into the detection logic itself, the columns and thresholds that decide what counts as abnormal.
What a Healthy Reading Cycle Looks Like, and Who Does Each Step
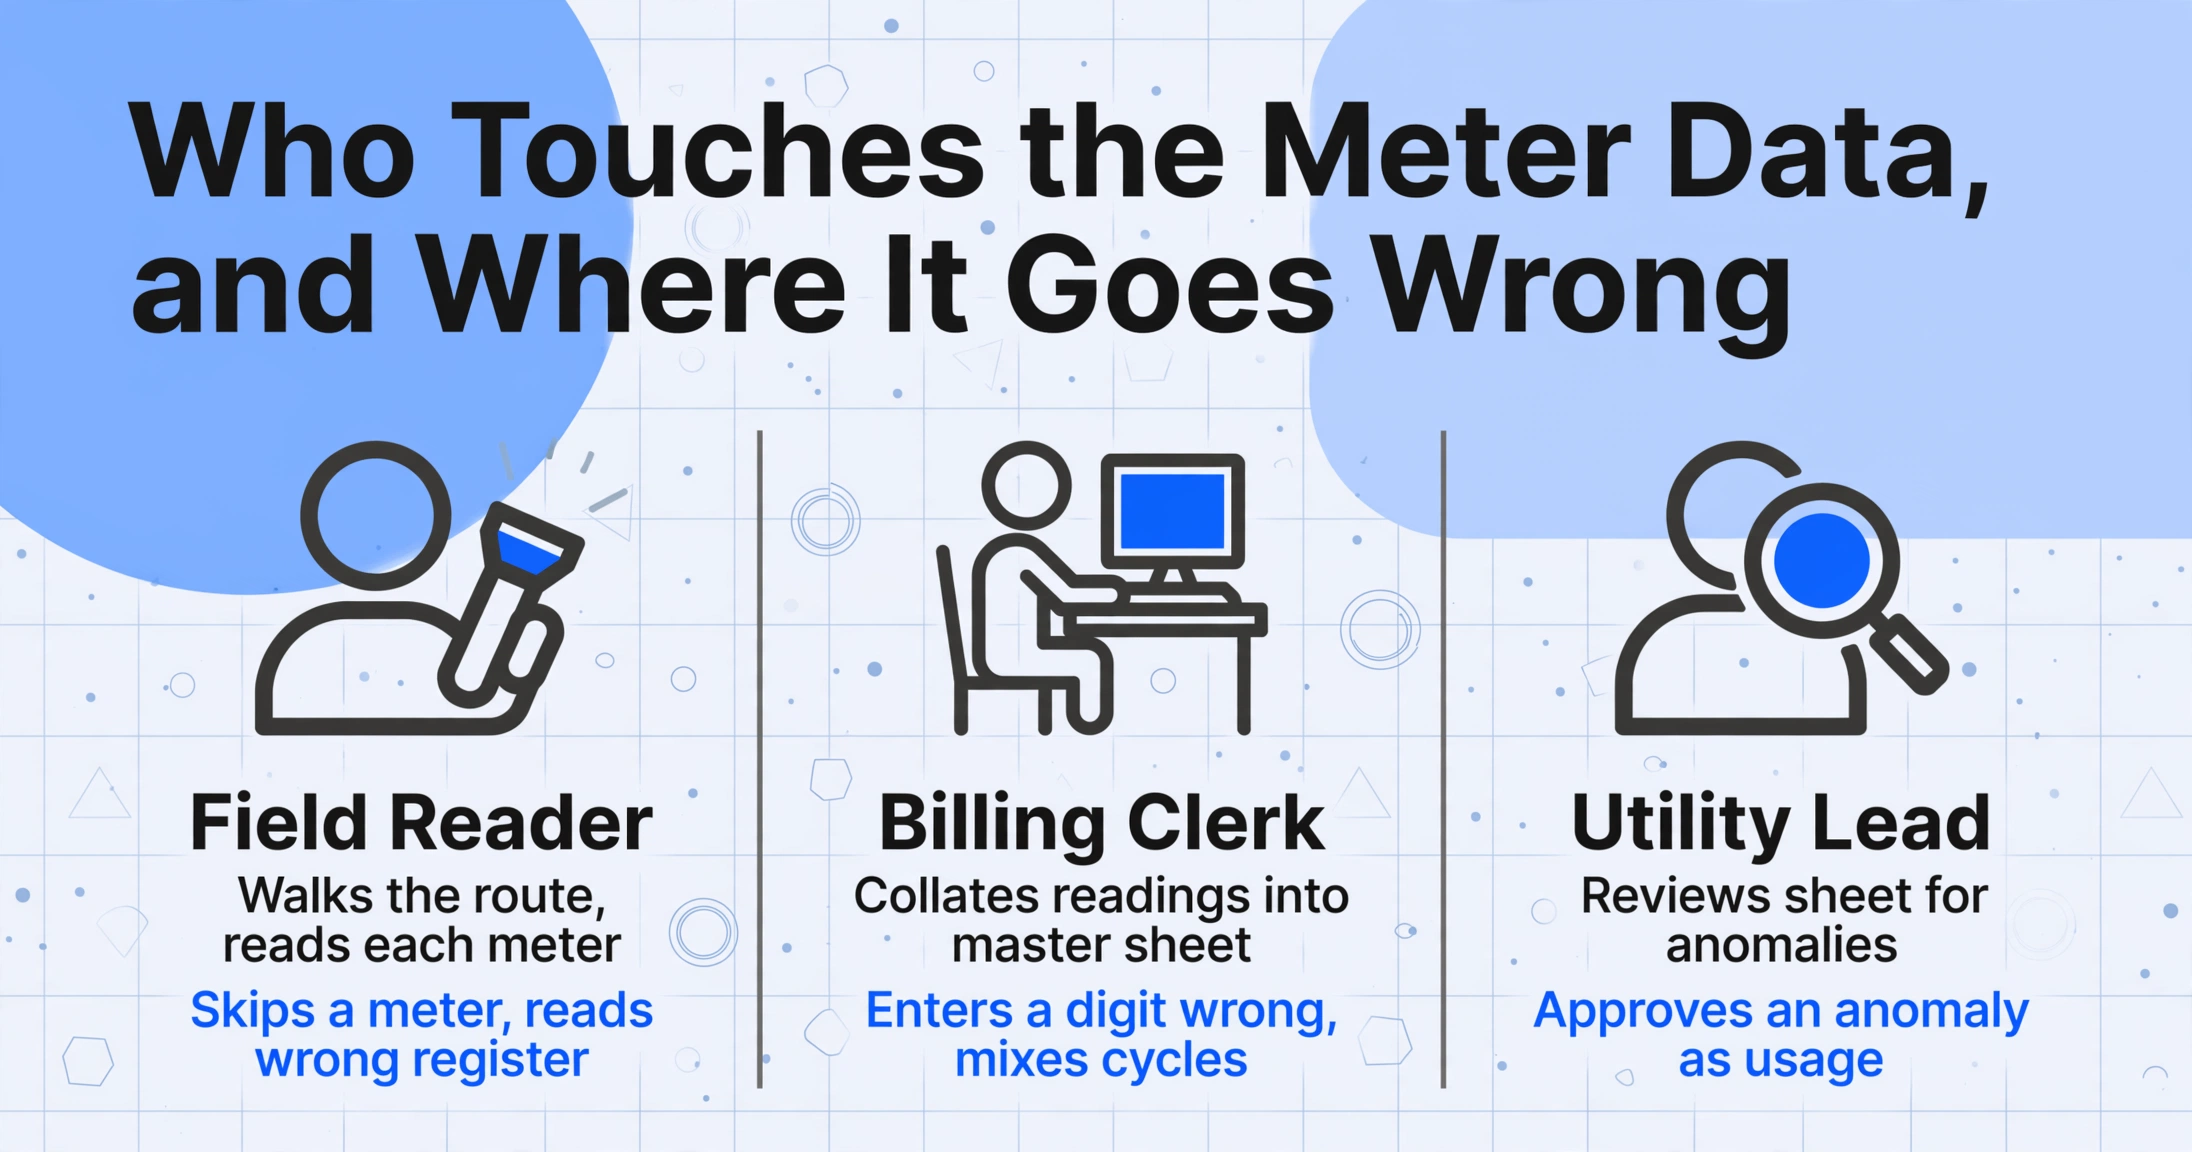
An anomaly only exists relative to a baseline, so any detection setup needs a clear picture of the normal cycle and the roles inside it. Three people touch the meter data in different places, and the detection logic has to survive all three handoffs.
| Role | What they actually do | Where the data can start going wrong |
|---|---|---|
| Field reader | Walks the route, photographs or reads each meter, notes the unit and the register value | Skips a meter, reads the wrong register, photographs glare or a partial display |
| Billing clerk or utility coordinator | Collates every reading into a master sheet, computes consumption, ties each unit to its rate | Enters a digit wrong, mixes two cycles, pastes an old value as this month's read |
| Utility or facilities lead | Reviews the sheet for anything worth investigating, dispatches maintenance, answers disputes | Reads 150 rows as numbers instead of as relationships, approves an anomaly as "usage" |
The arithmetic underneath is one line: consumption for the period is the current reading minus the previous reading. Everyone in the chain knows this. The problem is that subtraction is a decision, not a keystroke: it only means something when the two readings belong to the same meter, the same unit, and comparable numbers of days.
Why a 150-Row Sheet Defeats the Human Eye
Nobody on a route is lazy about this. The failure is built into the shape of the sheet. Five habits of the manual workflow each independently hide anomalies, and they compound:
Readings are entered and reviewed one row at a time. The clerk or lead looks at a column of register values: 412, 1,208, 873. In that frame, 873 is just a number. The value that would make 873 suspicious, last month's 401, lives in a different batch, a different file, or memory. At the moment of review, the one comparison that matters has no column on the page.
Registers are not consumption. Electric meters multiply by a register multiplier, water meters are read in gallons or cubic feet depending on the block, and a building on both services produces values that cannot be compared across columns without normalization. A 41,500 kWh register value and a 4,150 reading from two years ago might be the same consumption if a new meter with a different multiplier was installed. The raw sheet does not say.
A meter swap resets the register, which manufactures an anomaly. Utilities replace meters, and the new register starts near zero. The delta against last month's high read goes negative, which looks like theft or a data error, or astronomically positive if the clerk keys the old close-out reading against the new register. The industry's standard water balance even has an official category for this, apparent losses, defined in the IWA/AWWA water audit methodology as including unauthorized consumption, customer metering inaccuracies, and systematic data handling errors in the reading and billing process (Alliance for Water Efficiency, IWA/AWWA Water Audit Methodology). A swapped meter is a data handling event that looks exactly like a leak or a theft until somebody knows the swap happened.
Fixed thresholds fire on the wrong baseline. A flat "flag anything over 30% above last month" rule drowns in seasonality: an irrigation account jumps every summer, a heat-pump building jumps every winter, and a unit that filled a pool in April gets flagged for a change that was intentional. Detection that does not compare each meter against its own months mislabels normal cycles as leaks. The professional practice on the network side is the same principle at zone scale: water utilities detect leakage by watching the minimum night flow, the lowest 2 a.m. to 5 a.m. flow in a supply zone, and treat a persistent floor as the leak signal, not any single spike (IWA Water Loss Specialist Group, Minimum Night Flow). If a batch of readings is your only data source, your version of that is history per meter rather than flow per hour.
Nobody is assigned "the anomaly scan." The review happens, if it happens, in the same sitting as data entry, which is exactly the arrangement that guarantees it gets skipped. Real operators describe the cost of that arrangement in plain language. A homeowner whose bill jumped by roughly 9,000 gallons a month found the meter's leak detector "would spin only when the water level had dropped enough for the float switch in the toilet to open," a leak invisible in any reading until the meter itself was watched (r/homeowners, 2022). On the electricity side, the standard self-test for suspected theft begins the same way: turn everything off, wait, "check your power meter. If the reading has increased, it is very likely somebody is stealing your electricity" (r/DIY, 2023). Both checks are detective work; in a 150-row sheet, the question is which rows deserve that detective work at all.
The Detection Rules: Four Computed Columns That Find the Broken History
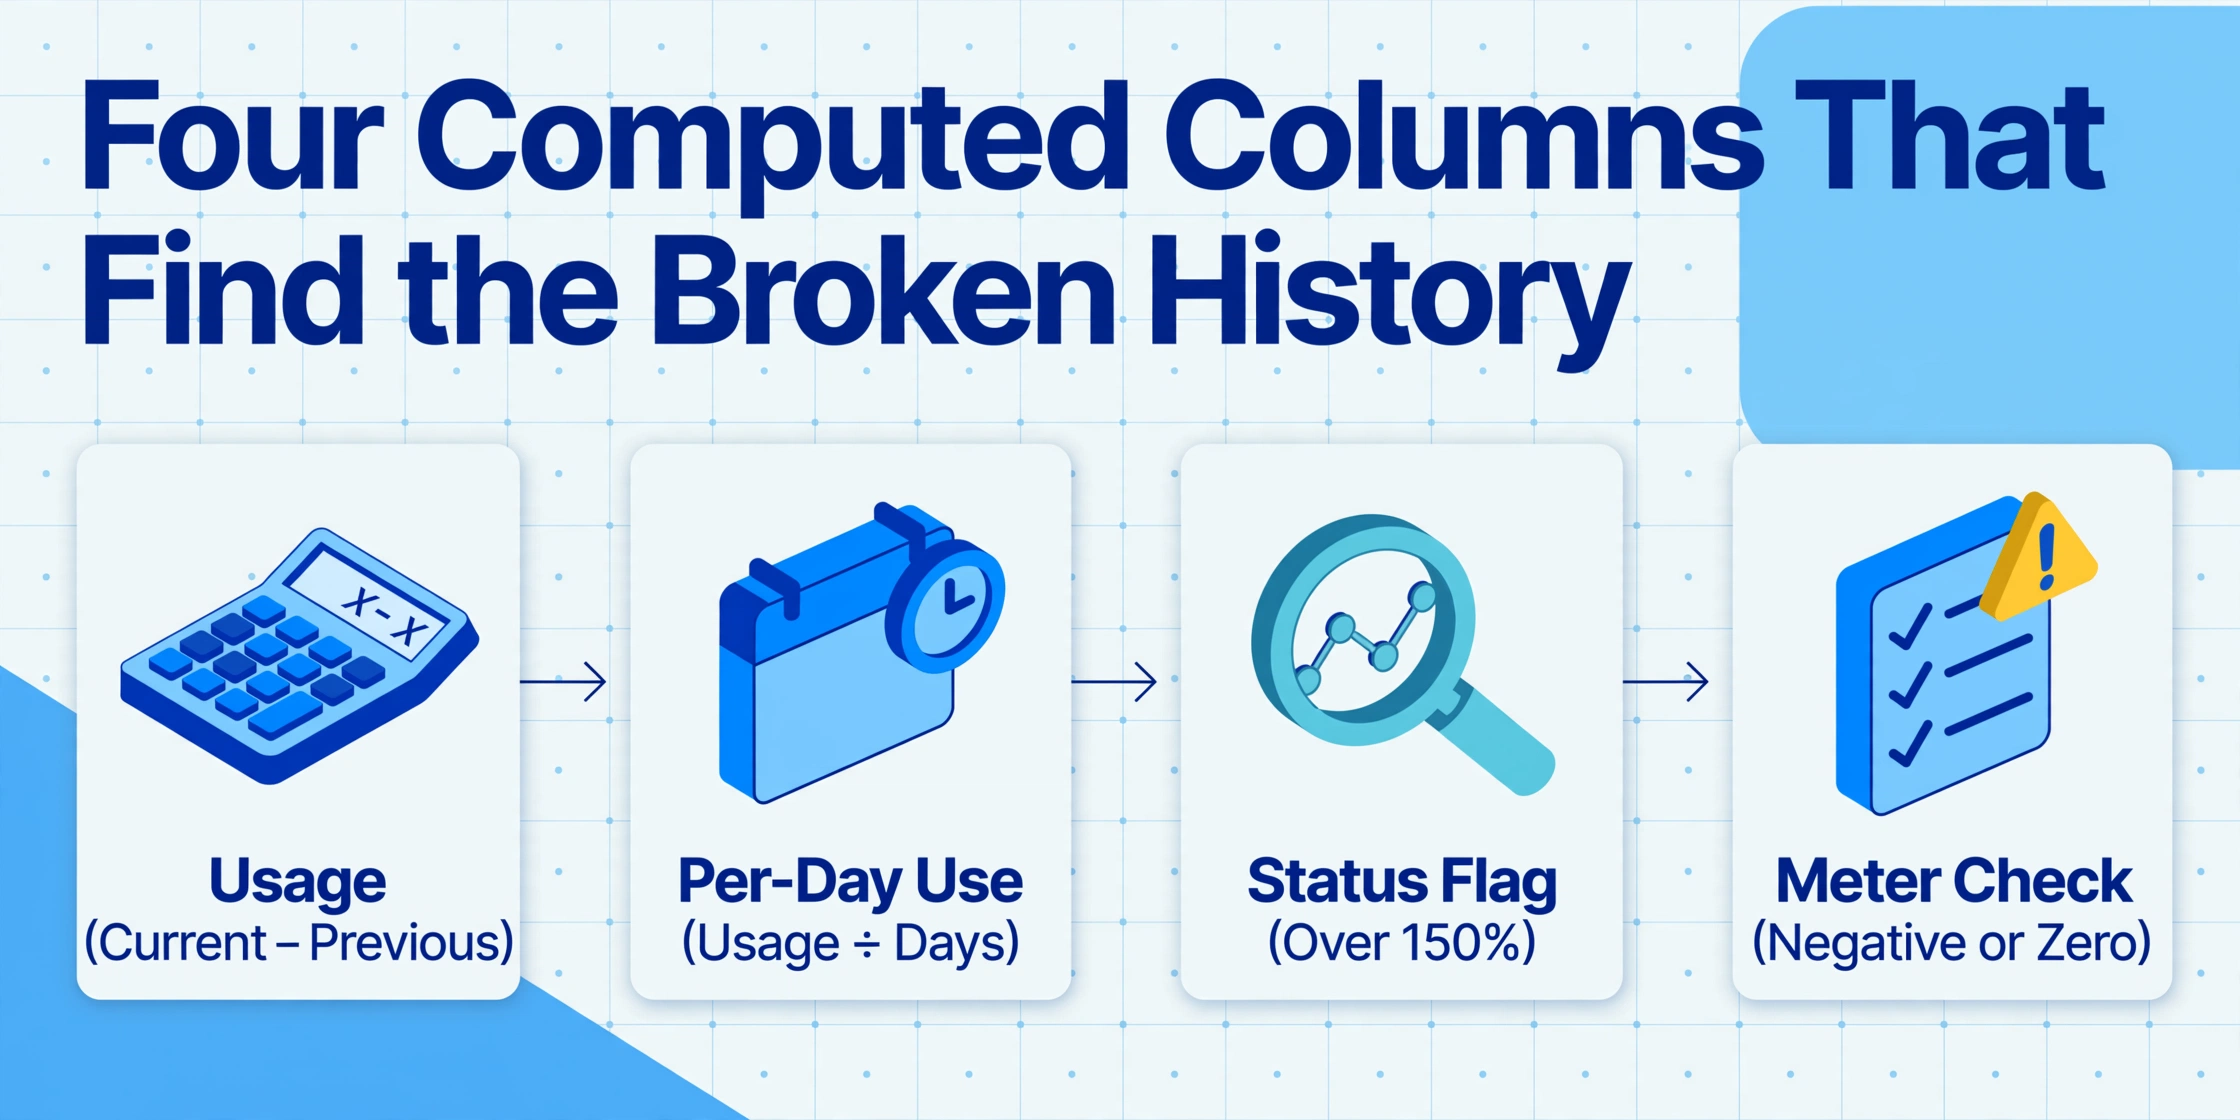
The fix is to move the comparison out of your head and into the sheet, with columns that the AI fills while it extracts. ImageToTable.ai's computed columns let you describe a calculation in the column name and the AI performs it during extraction, producing a ready answer column instead of raw numbers you still have to analyze. You define the columns you want, upload the whole route as one batch, and every row arrives with its anomaly flags already computed.
Build the consumption column that gives every row a neighbor
Extract Current Reading and Previous Reading as direct columns, then add a computed column Usage (Current Reading − Previous Reading). This is a row-level arithmetic rule: the AI reads both values and subtracts them in the same pass. It kills the "one row, no neighbor" habit, because every row now arrives with its period consumption already filled in, computed from the same two fields that were on the original sheet.
Normalize for cycle length with a fixed-parameter rule
Routes are read on schedules, not calendar months, so periods run 28 to 35 days. Comparing a 20-day usage to a 33-day baseline without adjustment flags perfectly normal movement. Add a computed column Per-Day Use (Usage ÷ Days in Cycle) and set Days in Cycle as the fixed parameter for the batch (30 is a sane default). Fixed parameters let the rule reference a number that never appears on the document itself. Per-day normalization is what makes cross-cycle comparisons honest.
Add the conditional rule that flags history breakers
Computed columns support conditional logic, the "if this, output that" case. A column like Status (Mark "Review" if Per-Day Use is more than 150% of Previous Per-Day Use) turns the normalized consumption into an explicit flag: the threshold is relative to that unit's own prior usage, not a global number, which is exactly the per-meter-history principle behind minimum night flow. Sorting the Status column brings the flagged rows to the top. First-cycle rows have no prior baseline and stay unflagged, which is correct, they become baselines next cycle.
Catch the negative and zero deltas that mean a check, not a bill
A negative Usage is almost never real consumption. It means a register reset after a meter swap, a transcription error, or a reading entered against the wrong cycle. A second conditional column, Meter Check (Mark "Inspect" if Usage is less than 0 or Usage is 0), separates these from the clean subtraction set. A zero on a meter that should move is a stuck meter or an unread register; a negative is a data event worth knowing before it gets billed as an anomaly or quietly absorbed as apparent loss.
The four rules map one-to-one onto the failure points from the previous section. The Usage column removes the one-row-at-a-time blindness. Per-Day Use removes the cycle-length distortion. The Status rule makes the comparison relative to each meter's own history, the fix for both seasonal false alarms and register-scale mismatches. Meter Check catches the swapped-meter and stuck-meter events that the industry counts as apparent losses. All of it rides on uploading the route as one batch, batch processing in ImageToTable.ai terms meaning every file runs through the same queue and lands in one merged table with the headers you named. A 60-unit building becomes 60 rows in one sheet, judged by the same rules.
Files are processed securely and not stored.
For routes that already run through a billing platform, the sheet and the flags are the part those platforms do not provide. CUSI's utility billing and mobile meter reading software moves readings into billing records (CUSI), Tyler Munis handles municipal billing (Tyler Technologies), and NorthStar runs customer information systems for smaller utilities (NorthStar). These platforms manage everything after the readings exist; the anomaly review still has to happen before that, and the cost context for small operations is covered in our breakdown for small utilities on a meter reading budget. If you are still choosing the tooling, the field comparison of AI meter reading tools covers that decision separately.
What the Rules Still Can't Tell You
A flag is a lead, not a diagnosis. The four columns automate the arithmetic and the surfacing; they do not decide what caused a break in history, and that judgment stays with a person. The whole set of possible causes for one flag looks like this:
| What the sheet shows | What it might be | Who confirms it, and how |
|---|---|---|
| Usage spikes past the 150% rule | Running toilet or leaking fixture, irrigation schedule change, new tenant, cycle-day stretch | Field check: shut off fixtures, watch the meter indicator, dye-test the toilet (r/Plumbing consensus: "my money is on a toilet, leaking past the flapper or stuck fill valve in the toilet tank," 2025) |
| Usage drops to near zero | Meter bypass or theft, vacant unit, occupancy change, meter stopped reporting | Field check: verify occupancy, inspect the meter bay, compare against service records |
| Negative Usage | Register reset after meter swap, transcription error, wrong cycle pairing | Records check: confirm the swap date and the close-out reading in service history |
| Repeated flags on one meter across cycles | Known seasonal account, a real ongoing leak, or a systematically misread meter | Billing lead: look at the unit's full year, not one cycle, before dispatching anyone |
The rules cannot physically confirm a leak, and they cannot attribute theft. A flagged meter still needs someone at the site, and the confirmation techniques are the classic ones, watching the indicator with everything shut off, dye-testing, or checking the meter bay. The contribution of the column logic is narrowing 150 rows to the handful worth a site visit, and flagging the data events (negative, stuck, reset) that would otherwise be silently absorbed into apparent losses.
Seasonal baselines need a year before they are trustworthy. In the first cycle, there is no previous usage to compare against, so the Status rule simply passes those rows through. Two or three cycles give a usable rolling baseline; a full year handles the irrigation-summer and heat-winter curves. Until then, treat flags on young accounts as "verify the reading," not "leak found."
This is the no-hardware path, and there is a hardware path that does more. Advanced metering infrastructure from vendors like Itron (Itron) and Landis+Gyr (Landis+Gyr) captures interval data and runs anomaly analytics continuously (Landis+Gyr's meter data management system alone processes data from tens of millions of endpoints). That is genuinely more powerful than monthly photos. But it is a decade-long migration for a non-AMI building stock, which is why the photo-to-sheet workflow exists at all. The column rules above are the bridge: the same per-meter-history logic, applied to the readings you already collect, on the hardware you already have.
FAQ
Can this workflow tell a leak from electricity theft? No. It tells you which meters broke their own history, and both a leaking pipe and a bypass drain show up as that kind of break. Differentiating leak, theft, meter error, and transcription error is field work, described in the table above. The value is that you now know which five meters to go look at instead of guessing across the whole route.
My first batch has no previous readings. What happens? The Usage column needs both values, so first-cycle rows are simply not judged; they become the baseline for the next cycle. This is expected, not an error. If your previous readings exist as a spreadsheet, upload or key them as the Previous Reading column and the rules work from the first batch.
Seasonal usage keeps tripping my threshold. What do I change? Use the per-day normalized column as the comparison basis, then widen the threshold or compare year-over-year for accounts with known seasonal patterns. A 150% rule on per-day usage is a starting point, not a mandate; an irrigation-heavy building may need 200%, a stable efficiency apartment can run tighter. The conditional rule makes the threshold a parameter you can change without touching the data.
My readings are already typed into a spreadsheet. Do computed columns still help? No, and you do not need them. The columns earn their keep when the reading arrives as a photo or handwritten sheet and the analysis is computed in the same pass as the extraction. If the numbers are already keyed in, a spreadsheet formula does the same subtraction and flagging with no AI involved. The tool's value here is skipping the typing and the manual sheet-building, not replacing Excel.
Do I need smart meters or submeters for any of this? No. The workflow starts from photos of analog dials and digital displays, which is exactly the gap the camera-plus-AI bridge fills for buildings not ready for an AMI rollout. Submeters add value by isolating a unit's usage in the first place; they do not change the detection logic.
How often should I run the anomaly review? Every cycle, in the same session where the readings land in the sheet. That is the entire point of the Status and Meter Check columns: the review is a sort of two columns, not an evening of mental arithmetic. The longer anomalies sit unflagged, the longer a leak, a theft, or a data handling error compounds into apparent loss.
A reading is not wrong because it is big. It is wrong because it stopped agreeing with itself. The four columns are how a 150-row sheet finally gets to say which rows that is.