Compare Bulk Meter Readings in One Batch
Catch Leaks and Stuck Meters Early
A meter reading is never suspicious by itself. 54,610 gallons is just a number that belongs to the unit on the second floor, and judging it means remembering what that unit used last month, last summer, last winter. The reading only becomes a signal when it sits next to the previous one, and that comparison is the step most bulk meter workflows never turn into a decision.
Key Takeaways
- A 4,000 to 12,000 gallon jump across one billing cycle reads exactly like a normal 12,000-gallon month until somebody subtracts the two numbers.
- Every billing platform handles the numbers after they exist, so the side-by-side check that would flag an outlier before a tenant disputes the bill is nobody's job.
- Upload the whole route as one batch in ImageToTable.ai and let a computed Change column do the subtraction, so the outlier surfaces in a sort instead of a dispute.
The Outlier Only Appears When This Month Sits Next to Last Month
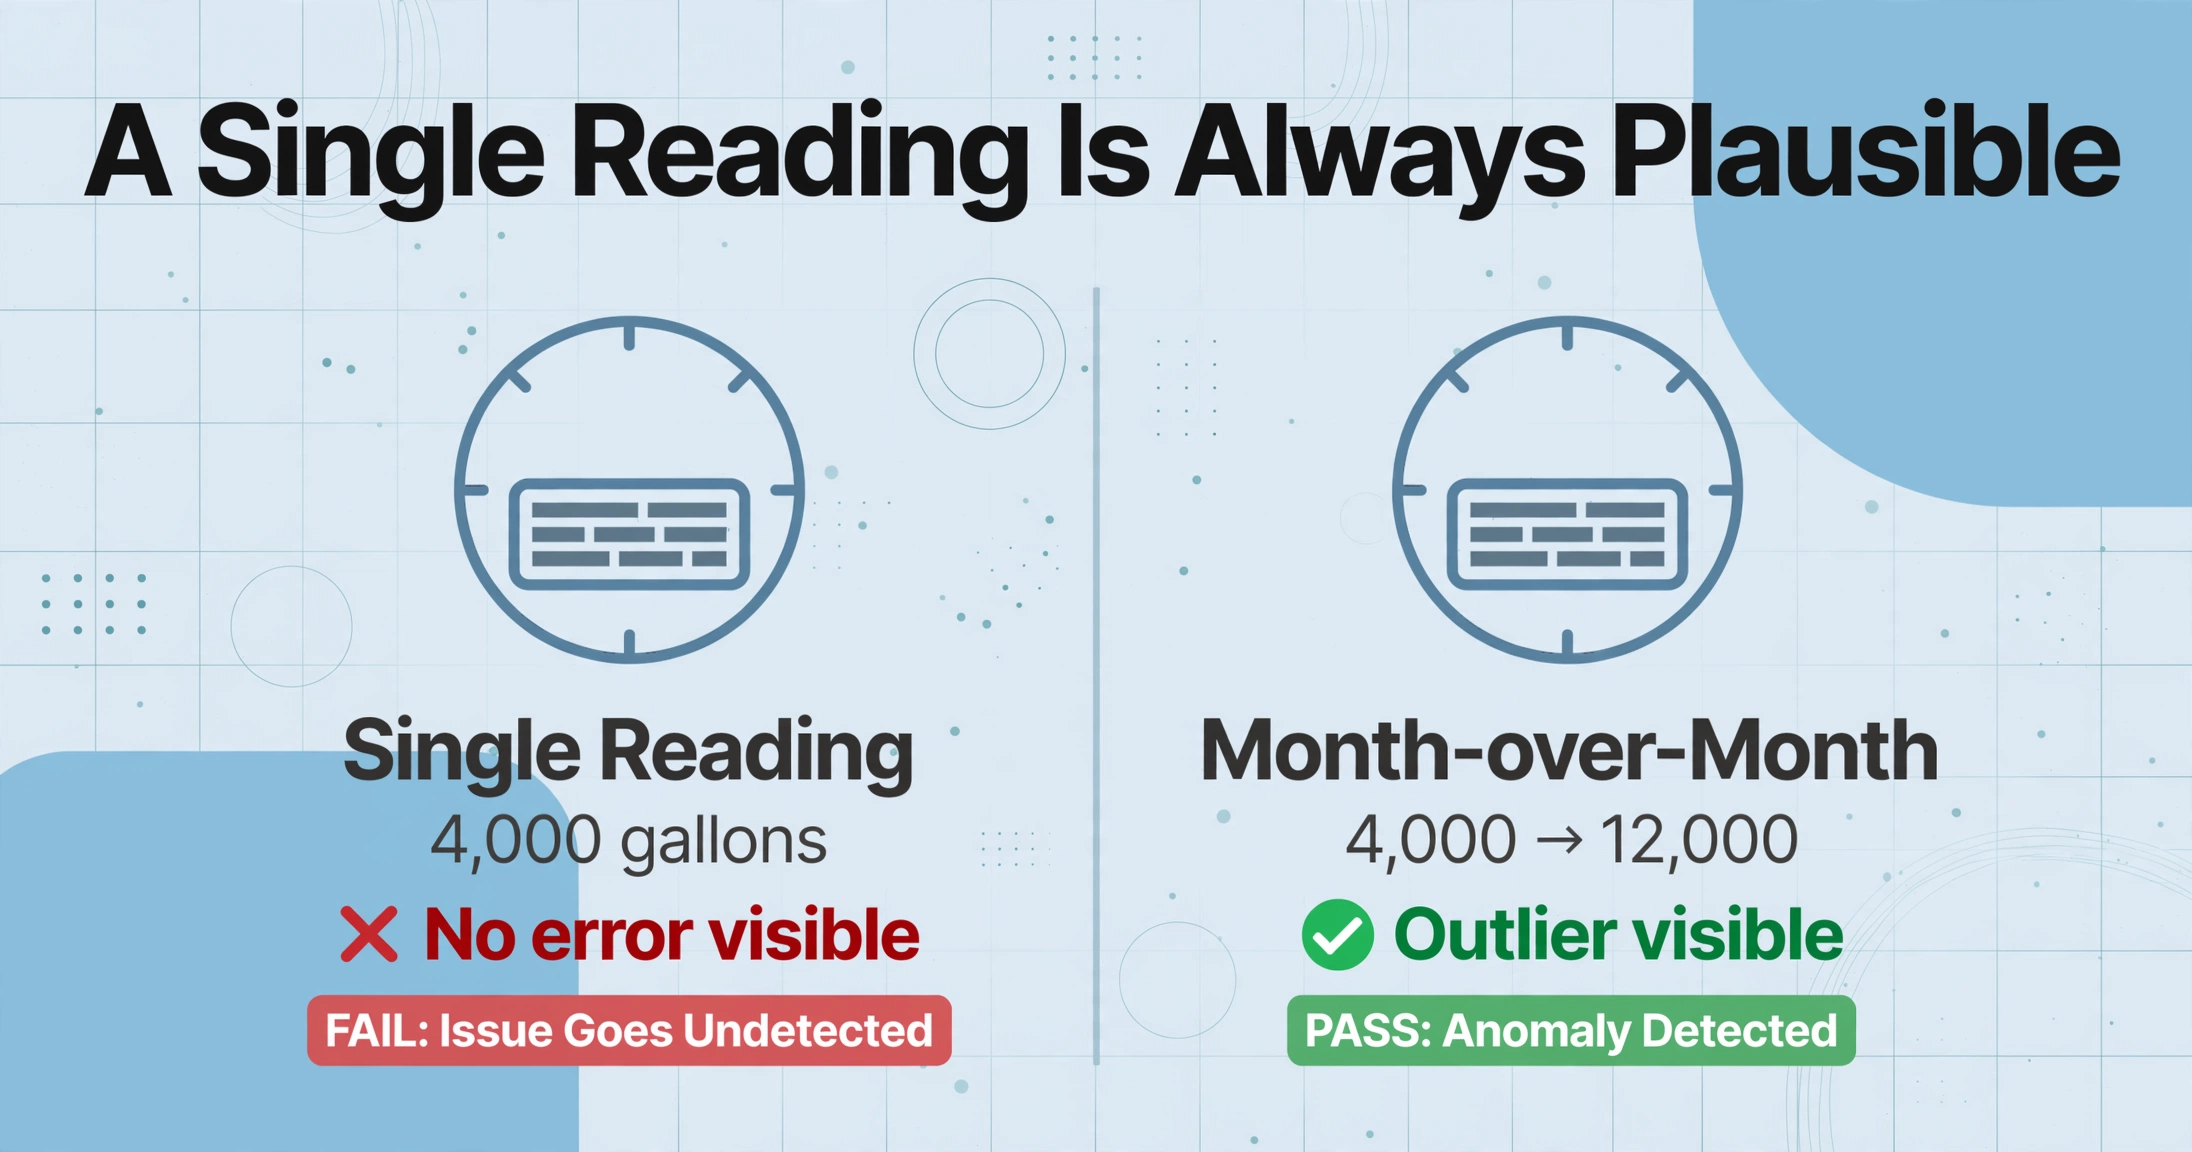
Routine household leaks are big enough to be visible in a month-over-month comparison, and they stay invisible in a single reading. EPA's WaterSense program puts the average home's leaks at nearly 9,300 gallons a year, with 9% of homes leaking 50 gallons or more a day, and a misaligned toilet flapper alone can add about 8,600 gallons in a month (US EPA WaterSense). None of that shows up as an error in a single meter photo. A unit that jumped from 4,000 to 12,000 gallons in one billing cycle reads exactly like a unit that used 12,000 gallons, until somebody subtracts.
A single reading is always plausible. An outlier is only visible when this month's number sits next to last month's.
That is why the meter-reading content you will find elsewhere, including our own complete guide to meter reading data extraction, stops at getting one number out of one photo accurately. Recognition is a solved enough problem. The job this article covers is the next one: you have readings for 60 or 200 units, and you need the comparison step to surface the ones worth a second look before a tenant disputes their bill.
Who Reads, Who Collates, and What a Clean Cycle Looks Like
Bulk meter comparison involves three roles, and each one fails at a different point. The person who walks the route, the person who puts the numbers into a billing record, and the person who would have to notice an anomaly are rarely the same person.
| Role | What they actually do | What can go wrong |
|---|---|---|
| Field reader or property manager | Walks the route, photographs or reads each meter, notes the unit and the number | Writes the wrong number, reads the wrong meter in a shared pit, skips a unit |
| Utility clerk or management accountant | Collates every reading into a billing record, computes consumption, ties each unit to its rate | Types a digit wrong, misses a unit, copies a previous cycle's value instead of this one |
| Billing or maintenance lead | Issues tenant charges or utility bills, investigates anything a customer questions | Nothing is questioned until a bill is disputed, so anomalies surface late and as complaints |
A clean cycle has a simple arithmetic behind it: consumption for the period is the current reading minus the previous reading. Meters are read on route schedules, not calendar months, so billing periods run 28 to 35 days and the same unit will legitimately drift from one cycle to the next. Cutting a spike in half because the cycle had 17 extra days is the kind of correction that happens only when the numbers are actually side by side. When volumes scale past a handful of buildings, the same math is what makes the difference between a small operation and one that needs a different system entirely, as explained in the guide to scaling meter reading without a full IoT rollout.
Why the Comparison Step Never Actually Happens
The failure is structural, not a lack of effort. Three habits of the manual workflow each independently kill the comparison, and they compound:
Readings are entered one line at a time, with only that line visible. The clerk types 54,610 and moves to the next row. At the moment of entry, nothing on screen invites a second thought, because there is no column showing what this unit used last cycle. The comparison is supposed to happen later, and later never has a reservation.
Estimated reads legally contaminate the delta. When a meter cannot be accessed, utility tariffs and state rules let the utility bill on an estimate, corrected the next time an actual read lands. Pennsylvania's rules, for example, require an actual or customer-supplied reading at least every six months to verify estimates (52 Pa. Code § 56.12). Any month with an estimate in the chain produces a delta that is partly a guess, and an operator comparing consumption needs to know a read was estimated before treating a jump as a leak.
Nobody is assigned "the comparison." It happens, if it happens, when a bill is disputed. The industry name for the cost of this silence is apparent losses: in the standard water balance used by utilities, the official categories include unauthorized consumption, customer metering inaccuracies, and systematic data handling errors in the meter reading and billing process (US EPA, Water Audits and Water Loss Control for Public Water Systems, 2013). A misfiled or mistyped reading is not a clerical footnote, it is a measured loss category with a name. At the global scale, the World Bank estimates 32 billion cubic meters of physical water losses a year and recommends utilities keep non-revenue water under 25% (World Bank Water).
Real operators describe the same hole from the ground. A landlord with an 8-unit building on one water meter posted that they cover water for tenants and the bill has been climbing since (r/Landlord, 2023). An investor sub-billing water wrote that their building's bills "would touch $500 per month several times per year" before a tenant landed a $1,500 water bill, months after the pattern started (r/realestateinvesting, 2022). And the comparison itself is slow when it does happen: watching for a slow leak on the meter "could take hours. The past readings are all available and appear to be correct" (r/AusPropertyChat, 2022). The readings were all available. The step that reads them as a series never ran.
Property-management and utility billing platforms manage everything after the numbers exist. Yardi's utility billing module handles submetered billing and ratio utility billing, calculating allocations and generating resident charges (Yardi). AppFolio partners the same way for multifamily (AppFolio). Harris' CitySuite accepts electronic meter reads from handhelds made for Itron, Sensus, and Badger hardware (Harris ERP). Every one of those platforms still assumes the readings showed up correctly. None of them makes the period-over-period delta visible for the person who has to catch the outlier. The manual cost of this pipeline is the subject of our breakdown of what manual meter reading actually costs, and the compliance angle is covered in the guide to preparing meter data for annual reporting.
The Fix: One Batch, One Sheet, and Columns That Compute the Change
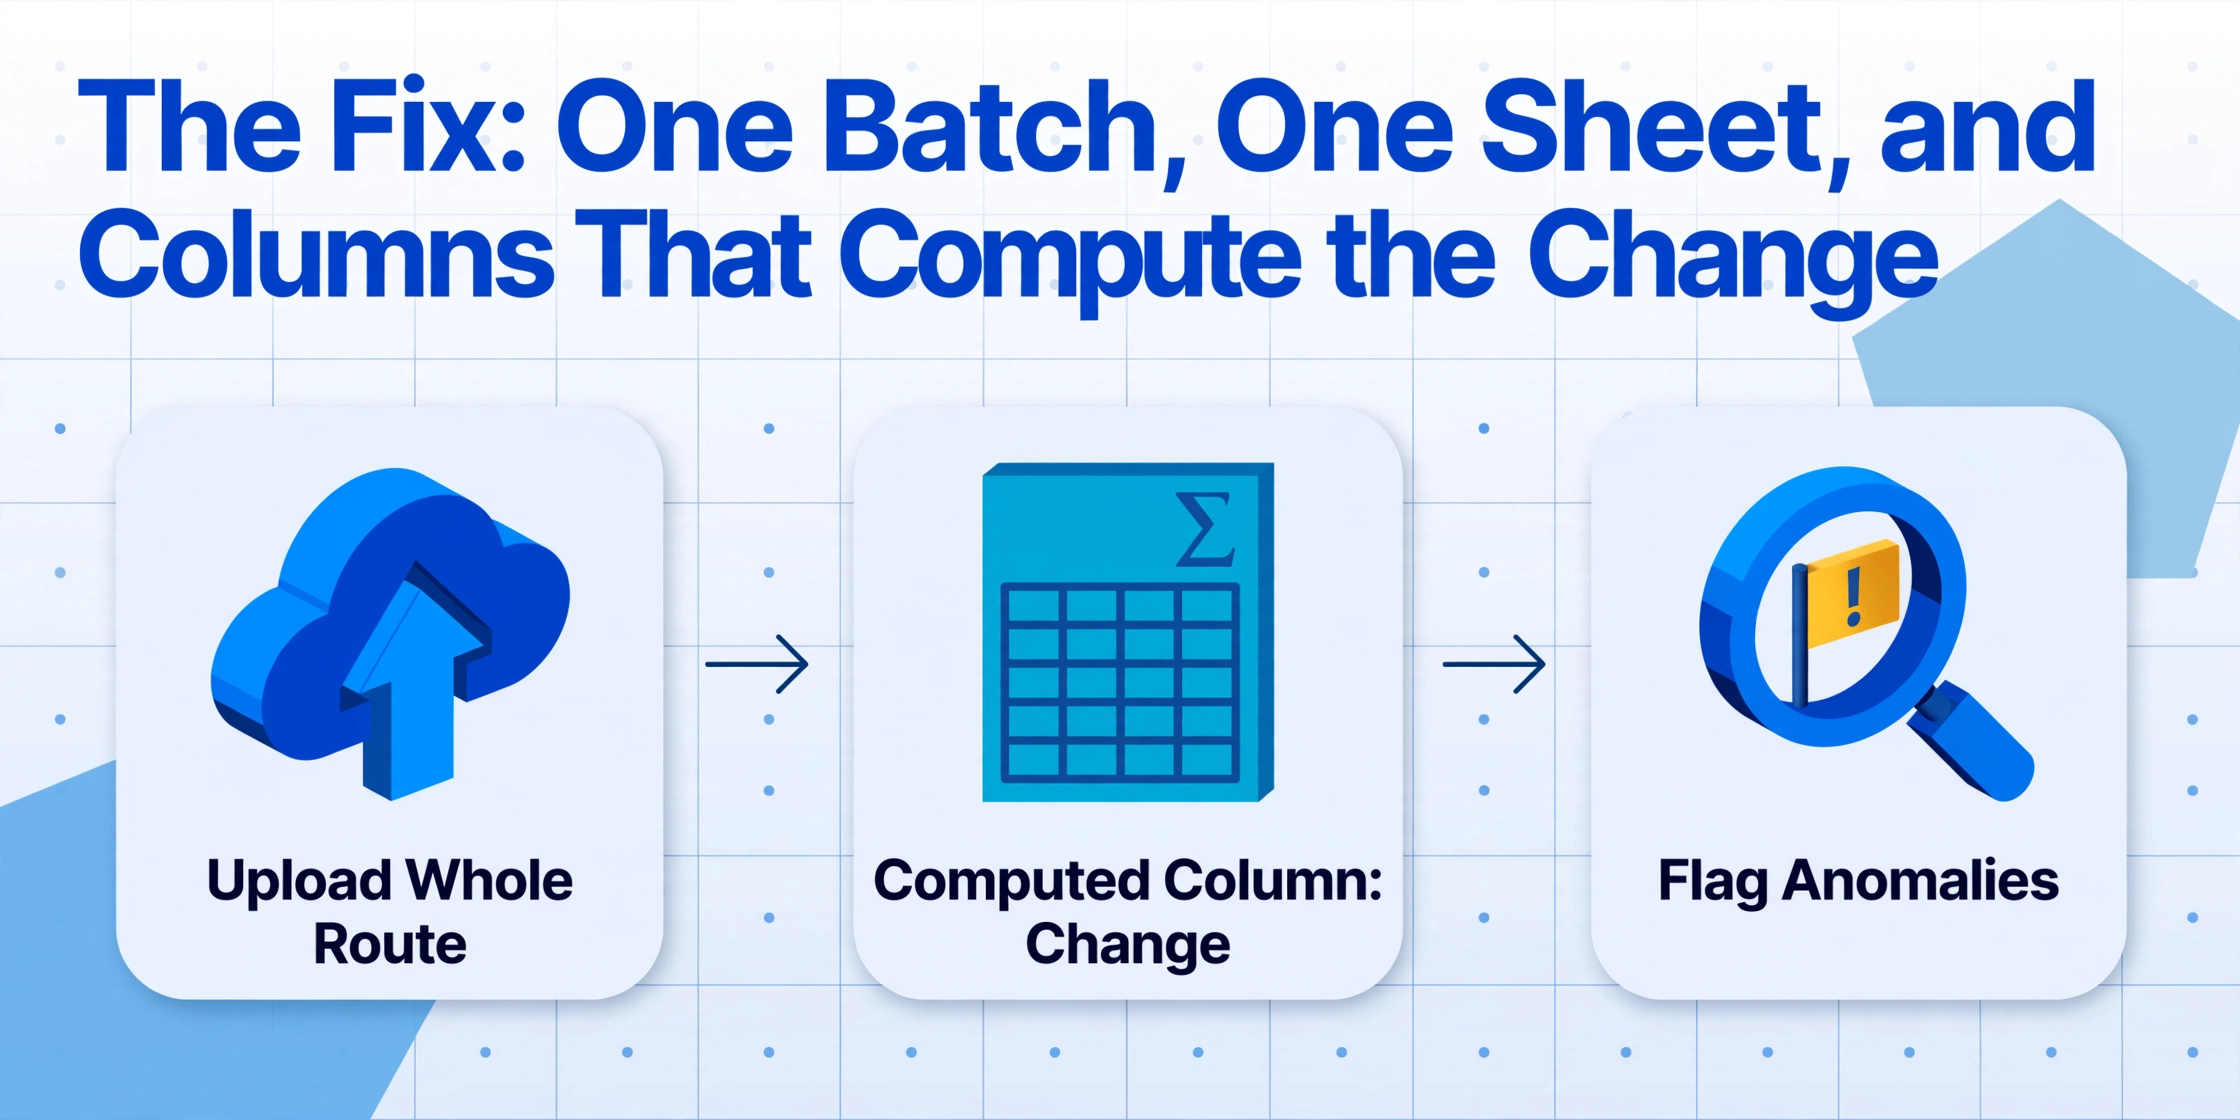
The comparison step becomes a default action when the workbook itself is built around it. Two settings in the extraction flow do that: processing the whole route as a single batch, and defining the delta as a column the AI computes while it reads. The workflow below assumes the numbers arrive as photos of meters or handwritten log sheets, which is the case for every non-AMI building we have described in the guide to reading any gauge from a photo into Excel.
Upload the whole route as one batch
Upload all the meter photos for the cycle at once. Batch-First Processing means every file goes through the same queue and comes out merged into a single table, with the columns you named as the headers. For a 60-unit building that is 60 photos and one sheet instead of 60 individual conversions. This is the setting that removes the per-photo work: no one re-keys a number, no one maintains a running list between uploads, and the header set is defined once for every unit.
Name a column that subtracts the previous reading
Include a computed column alongside the direct ones. Computed columns let you describe a calculation in the column name, and the AI performs it during extraction, so the output contains the answer instead of two numbers you still have to subtract. The column definition for this step is literally: Change (Current Reading − Previous Reading). Enter it as a column name, and every row in the sheet arrives with its period-over-period delta already filled in.
Add a conditional column that flags anything past your threshold
Computed columns also support conditional logic. A second computed column, Status (Mark "Review" if Change is more than 30% of Previous Reading), turns the delta into an explicit review list. The 30% is a threshold you choose; a large unit with a pool or irrigation will need a wider band than an efficiency apartment. The result is a sheet where sorting the Status column surfaces exactly the units that changed more than their own history says they should.
The two computed definitions above are the whole mechanism, and they map one-to-one onto the failure points from the previous section. The batch upload removes the one-line-at-a-time entry that kept the previous column invisible. The Change column removes the subtraction that was always going to be deferred. The Status column gives the "comparison" a named owner: anyone who opens the sheet can run it in a sort.
Files are processed securely and not stored.
If your readings need to land inside a spreadsheet your team already works from, the meter readings to Google Sheets article walks through folding the same extraction into a live sheet, and the meter reading to Excel page covers the single-batch conversion when you just need the table.
What the Comparison Still Can't Tell You
A period-over-period delta is a flag, not a diagnosis. The workflow automates the arithmetic and the surfacing; it does not confirm a leak, and it cannot decide what a spike means. Those judgments stay with a person, for three honest reasons.
A reading comparison cannot physically confirm a leak. A flagged unit still needs someone to check the meter indicator or the fixtures, or to call in leak detection. The delta narrows the search from "every unit" to "these five," which is the point, but the confirmation step is unchanged.
A spike is not always a leak. A new tenant, a pool filled in spring, an irrigation schedule change, or simply a 35-day cycle after a 28-day one can all push a unit past the threshold. Estimated reads make this worse: when a previous cycle was an estimate, the true-up lands as an artificial jump in the next actual delta, and the Status column will flag it even though nothing leaked.
The input is only as good as the photo. Glare, parallax on an analog dial, condensation, or a dirty cover can skew the reading itself before any comparison starts. The causes and the field fixes for bad meter photos are in the guide to why meter reading photos fail AI extraction. Rollover counters and meter multipliers also still belong in the column definitions, because the AI can only compute what the rule tells it to.
Treat the column output as triage. The first month a new unit appears has no previous reading, so its row cannot be judged until the second cycle. That is expected, not an error.
FAQ
Does this workflow catch a leak inside a billing period, or only after the next reading? It catches it at the next reading. Comparing this month's reading to last month's reveals that usage changed; it does not show a leak that starts and stops within a cycle. That is why the same people who run the monthly comparison also keep the meter-level check, watching the dial with fixtures off, as their short-horizon tool.
My previous readings are estimates from the utility. Will the comparison be wrong? The delta will be polluted by the estimate, and the flag column may fire on a jump that is just a true-up. Mark estimated cycles in the sheet (utility bills tag them with an E or EST marker) and treat flags that follow an estimate as "verify the read," not "leak found."
My readings are already typed into a spreadsheet. Do computed columns still help? No, and you do not need them. Computed columns earn their keep when the reading arrives as a photo and the subtraction happens in the same pass as the extraction. If the numbers are already keyed in, a normal spreadsheet formula does the same addition and subtraction with zero AI involved. The tool's value here is skipping the typing, not replacing Excel.
Do I need smart meters or submeters for this to work? No. The workflow starts from photos of any meter, analog dials and digital displays included, which is exactly the gap the camera+AI bridge fills for utilities not ready for an IoT rollout. Submeters help by isolating a unit's usage in the first place; they do not change the comparison step.
How many readings fit in one batch? A route's worth is the realistic scale, and the practical ceiling is your plan's batch limit rather than anything about the math. If you run more units than a single batch allows, the computed columns and the Status sort work the same way across several batches.
Does it handle handwritten meter-reading logs as well as meter photos? Yes. Handwritten log sheets are a standard input, which matters for buildings where the reader still walks with a clipboard; the log sheet goes through the same batch and the same computed columns.
The reading that sat in its own row for years becomes a signal the moment it has a neighbor. The batch and the delta columns are the settings that give every reading a neighbor.