AI Meter Reading Without Smart Meters
Read Any Gauge from a Photo, Get Excel in Seconds
In 2025, Eugene Water & Electric Board proposed a $20 monthly fee for customers who still needed their meters read manually. That single line item tells the story: manual meter reading is transitioning from an operational cost to an explicit surcharge — a penalty for not being on the smart grid yet. But here's the problem the fee doesn't solve: the global smart meter rollout, even at a projected $40.2 billion market by 2034, moves at the speed of physical installation. Millions of analog meters are still on walls, in basements, and behind locked gates. This article is about what you do in the meantime — how AI reads gauges from a photo, no hardware upgrade required.
Key Takeaways
- A meter reader walks 20 kilometers a day covering 700 meters — and the utility still charges $20 a month per manual read, because the decade-plus lag between approving a smart-meter budget and physically swapping every device means feet hit pavement every single day until the last meter is replaced.
- Every conventional automation approach — custom computer vision trained on one meter model, enterprise AI consulting with dedicated data-science capacity, and physical hardware replacement — gives you the right answer on a five-year plan and the wrong one on Thursday afternoon when billing closes.
- ImageToTable.ai reads any water, gas, or pressure gauge from a phone photo — not by matching a template that breaks on the next meter model, but by understanding what a reading looks like on any face, producing an Excel row in under 10 seconds with no per-gauge training.
The Smart Meter Gap: Why Manual Reading Isn't Going Away Soon
The smart meter market is projected to grow from $17.6 billion in 2024 to $40.2 billion by 2034 — a 7.9% compound annual rate driven by government mandates and utility modernization programs. Yet a 2024 survey of 121 US utilities found that 8.26% still enter meter readings by hand. And those are just the ones surveyed. Globally, the number of analog meters still in service runs into the hundreds of millions. Replacing them isn't a software project — it requires a physical technician visiting every location, swapping hardware, and verifying the install. At a utility with 50,000 meters, that's years of work, not months.
The gap between "we've approved the smart meter budget" and "every meter is replaced" is where most utilities, property managers, and industrial facilities actually live. During that gap — which can last a decade or more — someone still needs to read the meters. The question is whether that someone is a person with a clipboard.
Smart meter market: $17.6B in 2024, projected $40.2B by 2034. Meanwhile, 8.26% of US utilities still manually key in readings — and that doesn't count the developing-world infrastructure where the percentage is far higher.
What Manual Meter Reading Actually Costs
Manual meter reading isn't just slow — it's expensive in ways that don't show up on a single line of the budget. One Reddit user who worked as a meter reader in rural Australia described the reality: "Pay is minimal, management are unsupportive, dogs bite, have to work in all weather, walked up to 20km a day." Another in the water utility sector reported a mandatory quota of 700 to 900 meters per day, adding that "finding the meters is a task on its own." These aren't outliers. They're the baseline experience of the people utilities rely on to keep billing running.
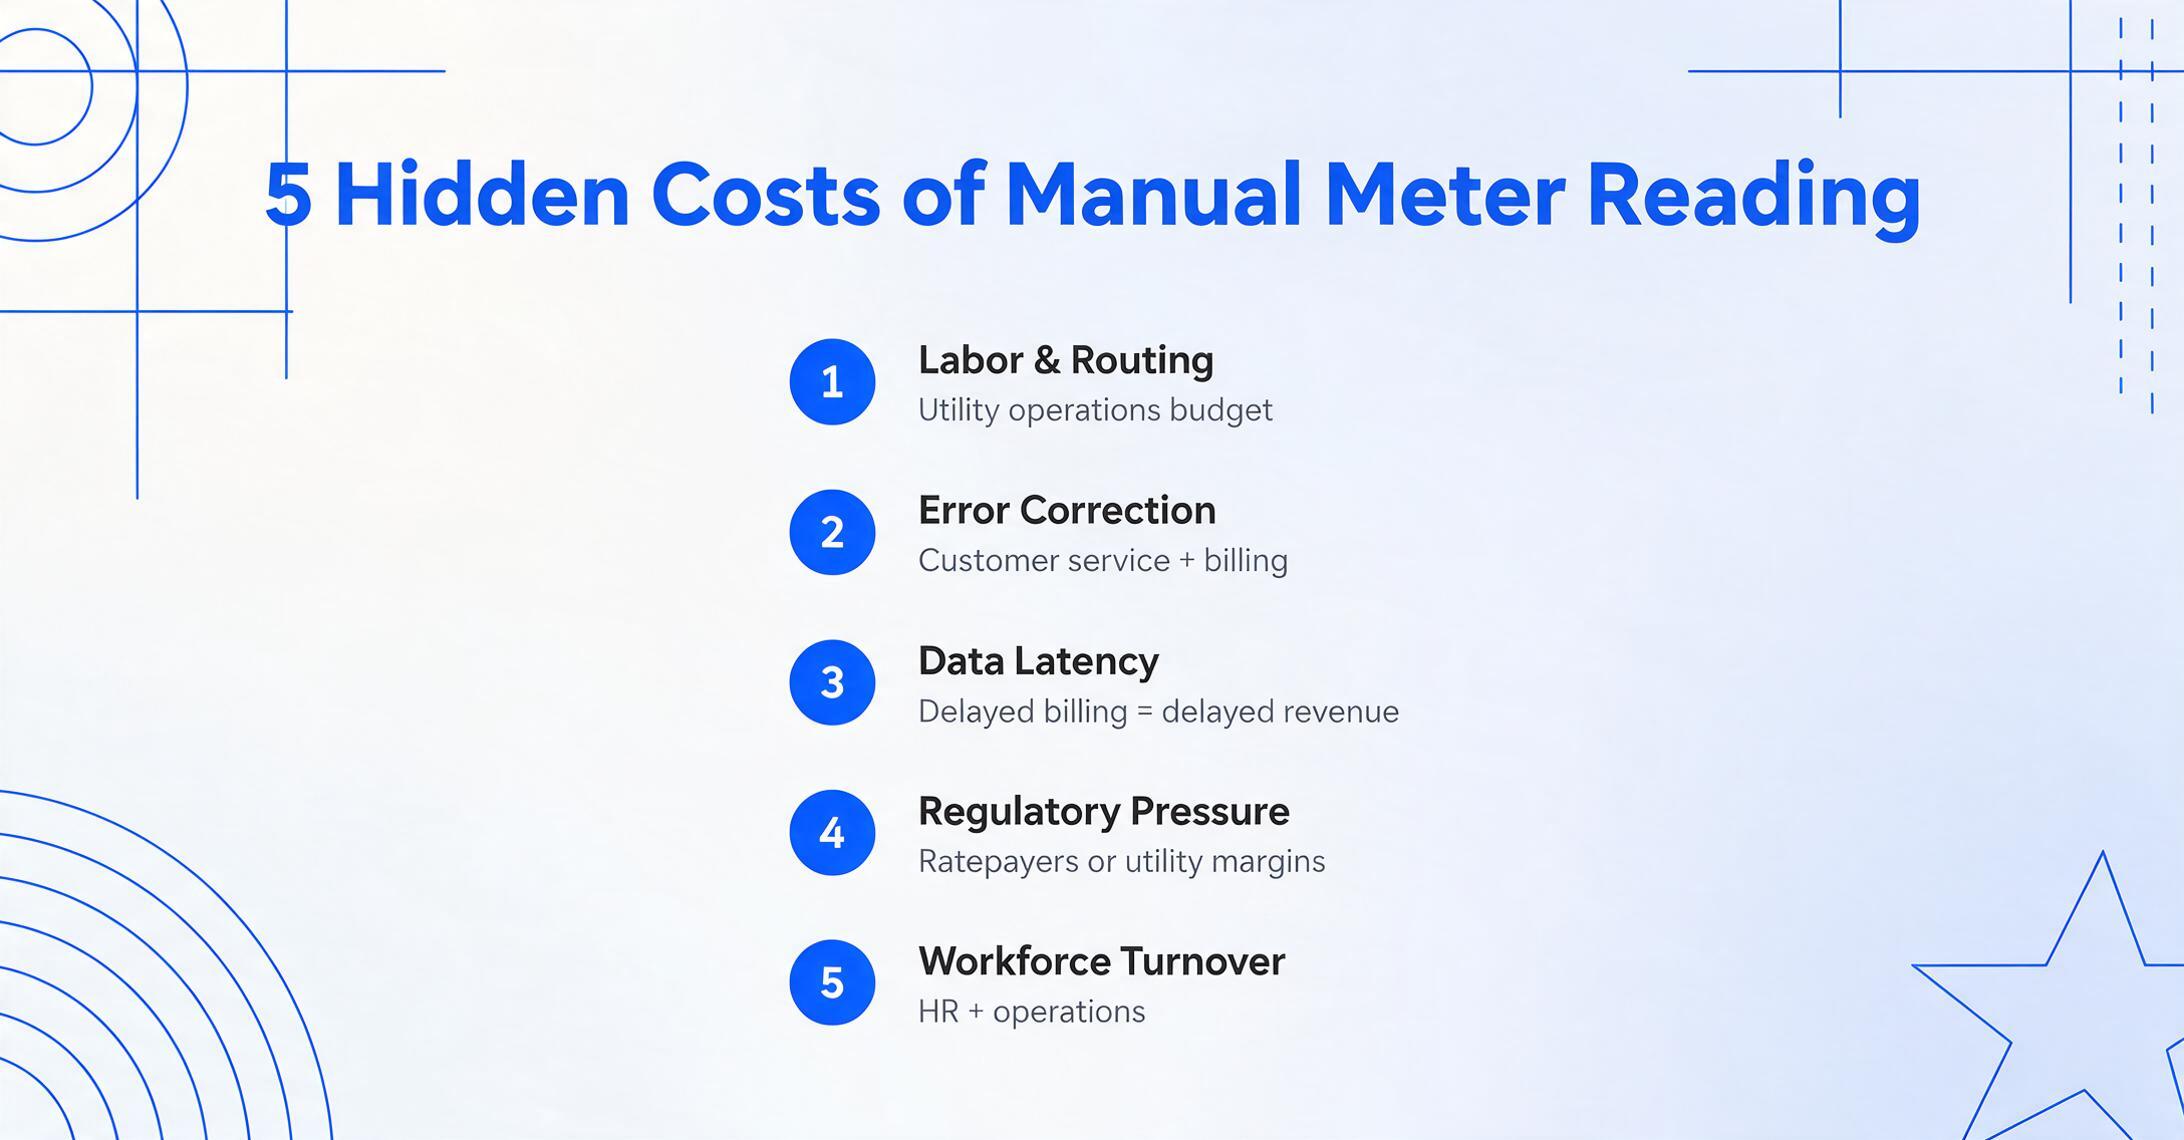
The costs break down into layers most organizations don't measure separately:
| Cost Layer | What It Actually Means | Who Pays |
|---|---|---|
| Labor & routing | Salary, fuel, vehicle maintenance, route scheduling for crews visiting every meter location | Utility operations budget |
| Error correction | Misread digits, transcribed numbers, illegible handwriting — each error triggers a re-read or billing dispute cycle | Customer service + billing departments |
| Data latency | Field-to-office lag: readings captured today might not reach the billing system for days | Cash flow (delayed billing = delayed revenue) |
| Regulatory pressure | EWEB's proposed $20/month manual-reading surcharge; New Jersey legislation to cap such fees — manual reading is being legislated out | Ratepayers (or utility margins) |
| Workforce | High turnover in a physically demanding role with minimal pay; hiring and training costs compound | HR + operations |
The City of Bryant, Arkansas faced this head-on. Their legacy radio-read system was failing, generating 5,000 manual reads per month. Before switching to cellular smart meters, that meant 5,000 physical visits, 5,000 hand-keyed entries, and an unknown number of errors entering the billing system every single month.
Why Traditional Automation Approaches Miss the Mark
There are three ways organizations typically try to automate meter reading. Each works in theory. Each fails in practice for most operations right now.
Custom computer vision models. The dominant approach covered in technical blogs — train a YOLO object detection model to recognize digits on your specific meter type, set up a camera pointed at the meter, pipe readings through MQTT to an IoT dashboard. A typical tutorial walks through every step: dataset annotation, model training, IoT dashboard setup, Python scripting, API key management, and hardware rigging. Each step is individually manageable. The problem is scope: the model you build works for the one meter type you trained it on. A utility with 14 different meter models across its service area has 14 separate projects — and each new meter model entering the fleet means starting over.
Enterprise AI consulting. Custom computer vision engagements — the kind that involve data augmentation on physical meters, fine-tuning detection models, and iterative improvement cycles with domain experts — produce accurate results. Published case studies confirm this. But these projects are resourced with dedicated AI teams, labeled training datasets, and months of development time. They're not a utility operations manager with an open budget line and a billing deadline. They're a capital project for organizations with dedicated data science capacity — which excludes most meter-reading operations.
Smart meter hardware replacement. The obvious long-term answer. It's also the most capital-intensive, slowest, and least flexible. Every meter must be physically swapped. Every install requires a truck roll. And when you're done, you've solved the problem for electricity — but what about the water meter that's a different vendor's responsibility? The gas meter managed by a separate utility? The pressure gauge in the boiler room that was never part of any smart-meter plan?
Common thread: these approaches optimize for completeness, not for now. They're the right answer in a five-year plan. They're the wrong answer on Thursday when billing runs on Friday.
How AI Reads a Gauge Without Being Trained on It
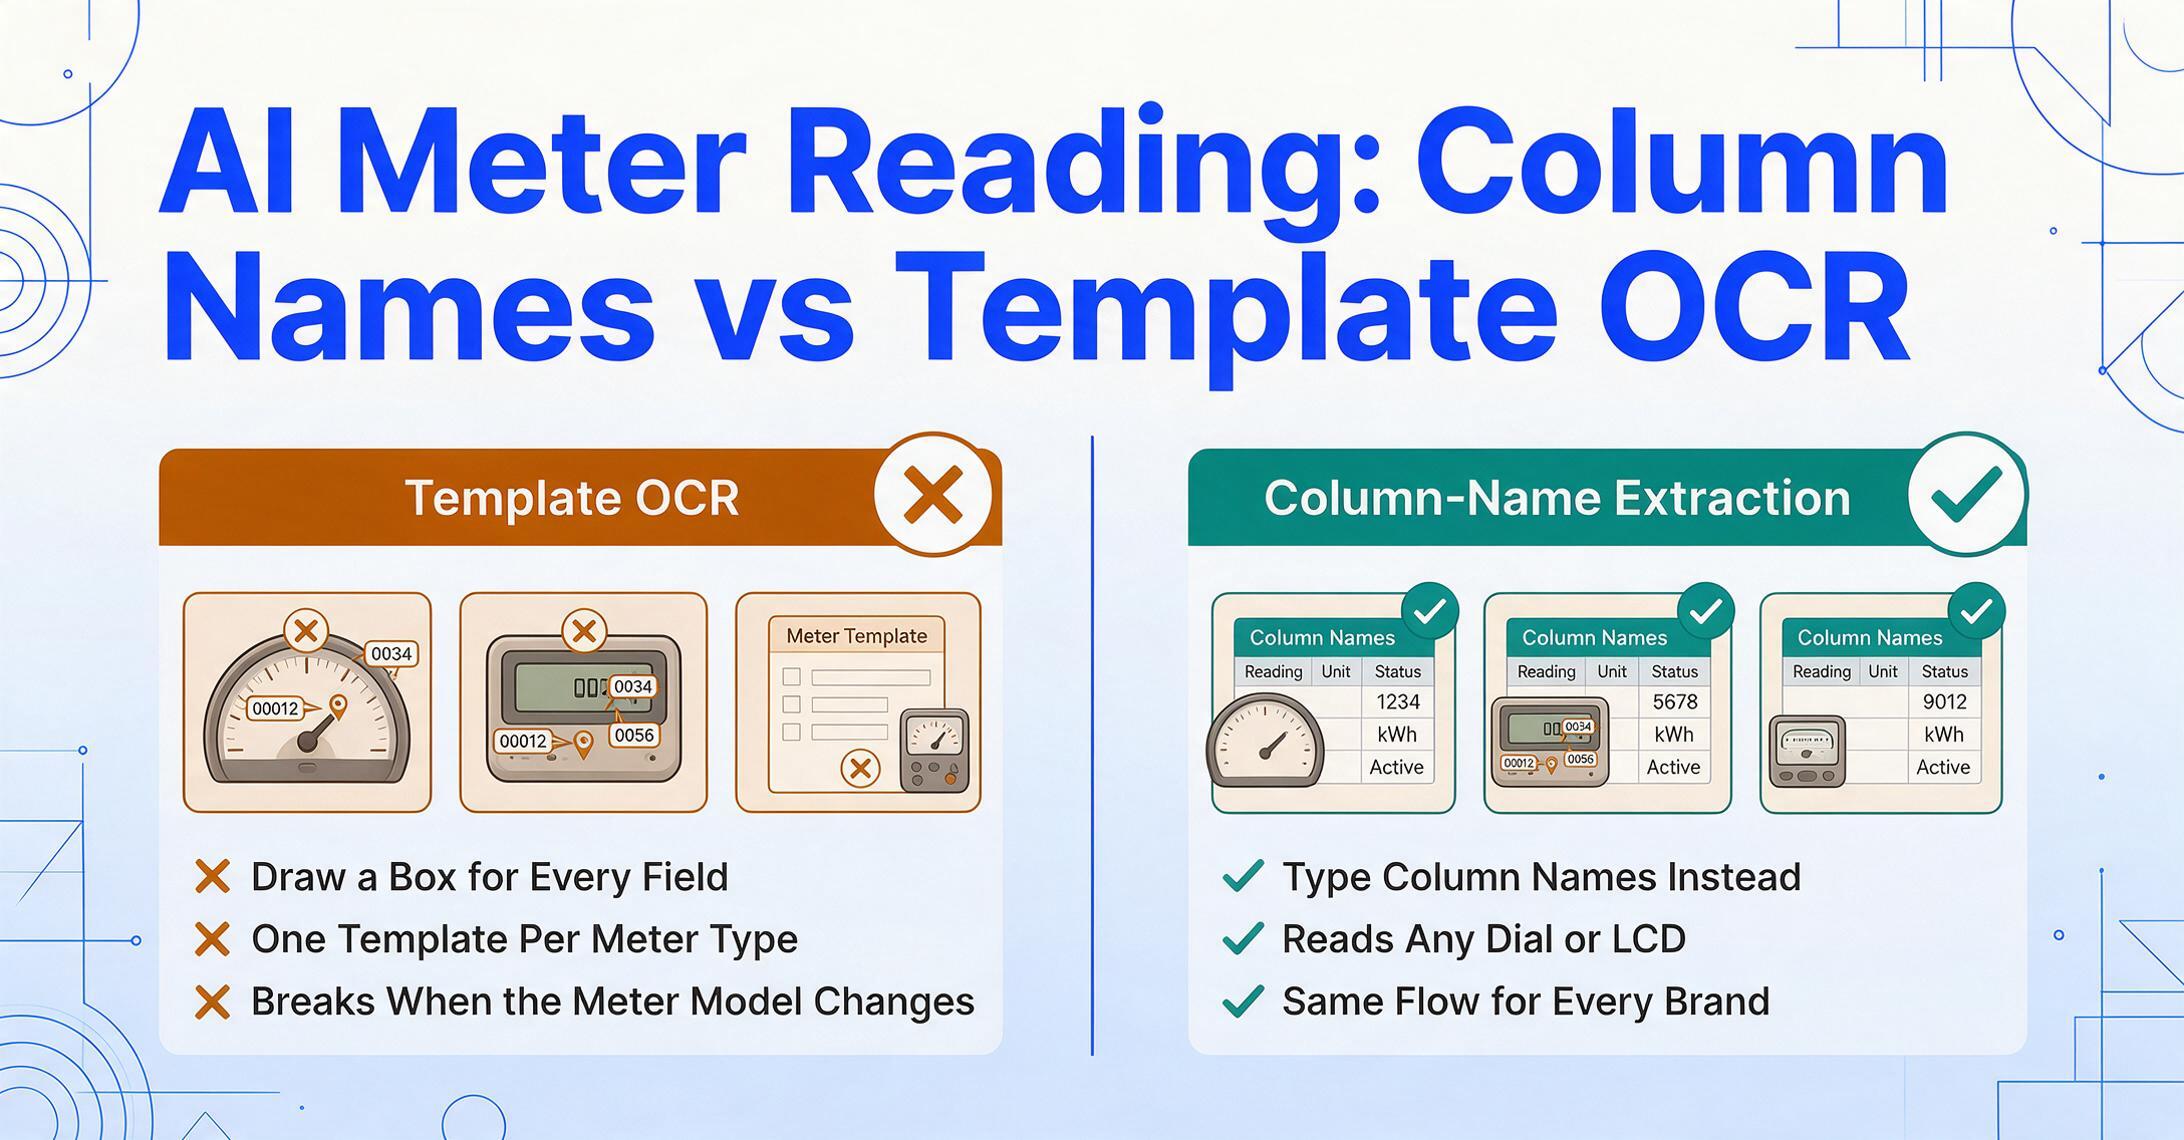
The key mechanism is column-name extraction. Instead of teaching an AI what a specific meter looks like — "this is a Badger Meter Model 35, the reading is in the fourth digit window" — you tell it what data you want: "Meter ID," "Current Reading," "Unit," "Reading Date." The AI uses visual understanding to locate those values anywhere on the image, regardless of meter brand, dial layout, or whether the display is analog or digital.
This is fundamentally different from template-based OCR, which requires you to draw bounding boxes around each field on a reference image. Template OCR works until the meter in the next building is a different model with the reading in a different position — then the template breaks. Column-name extraction doesn't care where on the image the value appears, because it understands what it's looking for, not where it was told to look.
The underlying engine is a vision large model — the same class of AI that can describe a photograph in natural language, but applied to structured data extraction. When it sees an analog dial with a pointer resting between 4 and 5 on a scale marked 0-9, it doesn't need to calculate the pointer angle and interpolate. It sees: "the needle is pointing to approximately 4.3." When it sees a digital display showing 0554876, it reads the digits in sequence, even if the photo is taken at a slight angle in low light. This is the difference between character recognition and visual understanding — and it's why the same system can handle a water meter with rolling digits, a gas meter with four analog dials, and a pressure gauge with a single needle, all from the same upload page.
A practical example: You upload a photo of a water meter and enter four column names: "Meter ID," "Current Reading," "Unit," "Reading Date." The AI returns a single row with each value populated — regardless of whether the meter ID is printed on a label, stamped into metal, or handwritten with a marker. One upload, one row of output. Upload 50 photos, get 50 rows merged into one Excel file.
Live Demo: Upload a Gauge Photo and See the Reading
The fastest way to evaluate whether this approach works for your meters is to test it. The demo below is a live instance of the AI extraction engine — upload any meter or gauge photo to see the output in real time. Prefer a dedicated page with meter-specific column presets already filled in? The AI meter reader tool runs the same extraction engine.
Files are processed securely and not stored.
The Workflow: Photo to Excel in Three Steps
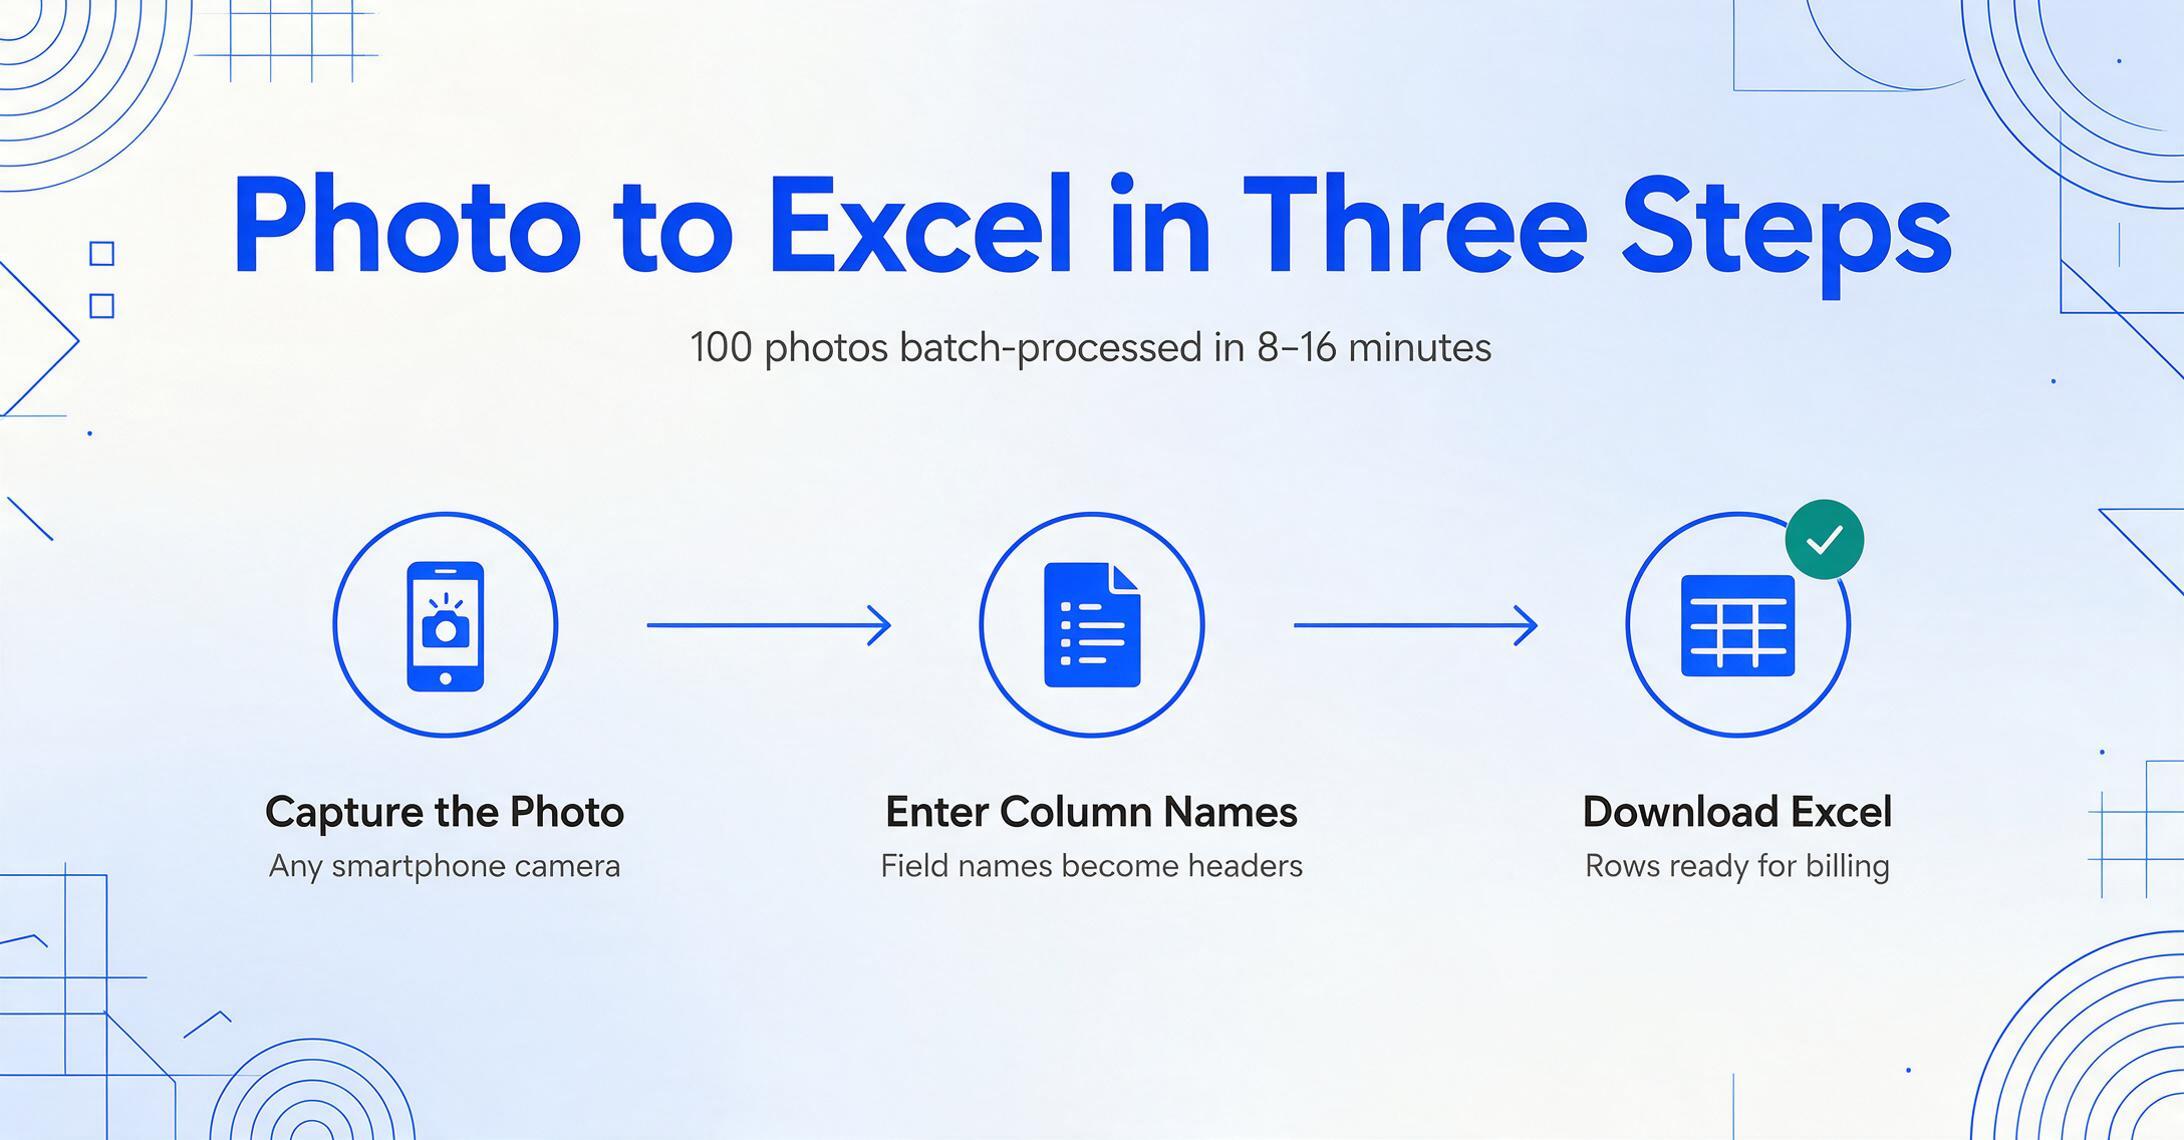
The operation is straightforward enough that field workers can use it without training, and flexible enough that office staff can process batches of hundreds of meters in a single session.
Step 1: Capture the photo. Any smartphone camera is sufficient. The AI handles moderate angles, varying light conditions, and mixed display types within the same image. A clear, direct shot of the meter face produces the best results, but the system is resilient to the real-world conditions of a meter in a dark basement or a gauge behind dusty glass.
Step 2: Define your columns. This is where the column-name extraction mechanism earns its value. Instead of drawing boxes on a reference image or writing parsing rules, you type the field names you want extracted. For a water meter: "Meter ID," "Current Reading," "Unit," "Reading Date." For a pressure gauge: "Gauge Location," "Pressure (PSI)," "Reading Time." The column names you type become the headers of your output table — they're both the extraction instruction and the output schema in one step.
| Field Name (what you enter) | What the AI looks for | Output Format |
|---|---|---|
| Meter ID | Any identifier — printed label, stamped serial, handwritten marker | Text |
| Current Reading | Main dial / digital display value | Number (up to 3 decimals) |
| Unit | Unit label near the reading (m³, kWh, PSI, ℉) | Text |
| Reading Date | Date visible on the meter or metadata from the photo | Date (YYYY-MM-DD) |
Step 3: Export and use. Single-meter extractions produce one row of data. Batch uploads — 50 meter photos at once — produce 50 rows merged into a single Excel file. Output formats include XLSX, CSV, and JSON. The data is standardized: dates are formatted consistently, numbers are cleaned, and column order matches your input. No post-processing required before the data enters your billing or asset management system. If you're ready to run this workflow on your own meter photos, the AI meter reader tool handles the full photo-to-spreadsheet pipeline directly.
What Types of Meters Can This Handle?
The system is not limited to one meter type, brand, or display format. The same upload interface handles analog dials, digital LCDs, hybrid meters, and industrial gauges without switching modes or reconfiguring.
| Meter / Gauge Type | Display Format | Typical Use | What the AI Extracts |
|---|---|---|---|
| Water meter | Rolling digits or analog dial | Residential / commercial billing | Reading (m³), meter ID, date |
| Electric meter | Digital LCD or spinning disc | Utility billing | Reading (kWh), meter number, tariff info |
| Gas meter | Analog dials (4+ dials) | Utility billing | Per-dial reading, combined reading, unit |
| Pressure gauge | Single analog needle + scale | Industrial plant monitoring | Pressure value (PSI/bar), gauge ID, timestamp |
| Temperature gauge | Analog or digital | HVAC, industrial process | Temperature (℉/℃), location, timestamp |
| Flow meter | Digital or analog | Water treatment, manufacturing | Flow rate, total volume, unit |
| Level indicator | Analog sight glass or digital | Tank monitoring | Current level, capacity, unit |
What the system does not do is real-time continuous monitoring. If your application requires second-by-second readings streamed to a SCADA system with alarm triggers, you need an IoT sensor installation — not a photo-based extraction tool. The system is built for periodic, batch readings: monthly billing cycles, daily inspection rounds, weekly equipment checks. That covers the vast majority of meter reading use cases.
Bridging Legacy Meters to Modern Workflows
The most practical integration pattern for field operations uses Collection Links — shareable URLs that let anyone upload meter photos directly to your processing queue. A field worker receives the link, opens it on their phone, enters a short verification code, and uploads photos from their camera roll. The files appear in your account's processing queue immediately. The worker doesn't need an account. They don't need login credentials. They don't need to install an app.
This eliminates the most fragile step in the manual workflow: the handoff between the person who takes the photo and the person who enters the data. Instead of a field team emailing photos or transferring files at the end of the day — and an office team opening each one individually the next morning — Collection Links collapse the pipeline into a single flow. Photo taken → data available for extraction → Excel export.
For teams that run their billing or asset tracking through spreadsheets, the Google Sheets add-on provides an even tighter integration. Upload a meter photo from the Sheets sidebar, specify your column names, and the extracted data appends directly to the current sheet. This keeps the entire workflow inside the spreadsheet environment that utility and facility teams already use — no switching between tools, no copy-paste, no re-export. If your billing pipeline already lives in a spreadsheet, see our guide to fitting AI meter reading into an existing Sheets billing pipeline for the exact column layout that keeps your formulas untouched.
The architecture doesn't replace your SCADA system or smart meter platform. It fills the gap between them — between the legacy meter on the wall and the digital data you need to run billing, compliance reporting, and consumption analysis. For organizations still years away from full smart meter deployment, that gap is where the real operational cost lives. Read how Collection Links handle the full collection-to-extraction pipeline →
Frequently Asked Questions
How accurate is the AI at reading analog dials?
For printed digits on meters (digital displays, rolling counters), the system achieves up to 99% accuracy — comparable to a careful human reader. For analog dials with needles, accuracy depends on photo quality: a clear, head-on photo under normal lighting produces reliably correct readings. Severely angled photos, heavy shadows, or cracked gauge glass reduce accuracy. The system handles a wider range of conditions than template-based OCR, but it's not immune to bad input — the same way a human reader can misread a fogged-up meter.
Can it read handwritten meter readings on a log sheet?
Yes. The vision large model recognizes handwriting, including cursive and mixed print/cursive entries. However, handwriting recognition accuracy is inherently lower than printed text — heavily smudged or extremely stylized handwriting may produce errors. For the core use case — reading the meter display itself rather than a log sheet — this rarely matters, since most meter displays are printed or digital.
Can I process hundreds of meters at once?
Yes. The batch processing mode accepts multiple file uploads in a single session and merges all results into one Excel file, one row per meter. Processing time scales linearly: each image takes approximately 5-10 seconds, so a batch of 100 meter photos completes in 8-16 minutes. This covers the daily or weekly output of most field teams.
Does it work with old or dirty meters?
Within limits. The AI compensates for moderate dirt, scratches, glare, and reflections. Cracked glass covering the dial, heavy rust obscuring digits, or extreme lens flare will degrade results. In practice, most meters in the field — even decades-old ones — are readable because utility crews and inspectors clean them periodically as part of routine maintenance.
Is this a replacement for smart meters?
No. Smart meters provide continuous, automated data transmission — they're the eventual destination for utility infrastructure. What AI meter reading replaces is the manual process during the transition. If your smart meter rollout is complete, you don't need this. If it's years away, this is the most practical bridge.
How much faster is this than manual entry?
A single page or meter photo that takes a human 2-3 minutes to visually read, record, and transcribe processes through the AI in 5-10 seconds — an 18x speed improvement. The larger efficiency gain comes from batch processing: 100 individual meter photos that would take a person half a day to key in complete in under 20 minutes with the AI, plus the elimination of transcription errors that trigger rework cycles.
See also: AI gauge reading for plant inspection rounds · field data collection from photos to Excel · manual vs. AI inspection cost comparison