How to Extract Lab Test Results from PDF Reports
into Excel — No Coding Required
The CLL Society — a national patient advocacy organization — maintains a free Excel template for tracking blood test results. It has tabs for CBC, blood chemistries, and immunoglobulins. It auto-charts values over time. It flags results outside reference ranges. It's thoughtfully designed and clearly the product of real patient need. And the data entry mechanism is the same one spreadsheets have used for 40 years: you open your lab report PDF, find the value next to "Hemoglobin A1c," and type it into the cell. When your next blood draw comes from a different lab that labels the same test "HbA1c (%)" and formats the report differently, you find the value again and type it again. The template is excellent. The data entry is the bottleneck.
Key Takeaways
- That number you just typed was digital the moment the lab machine analyzed your blood — it passed through databases and email servers as machine-readable data and the only non-automated step in the entire chain is your fingers moving from PDF to spreadsheet.
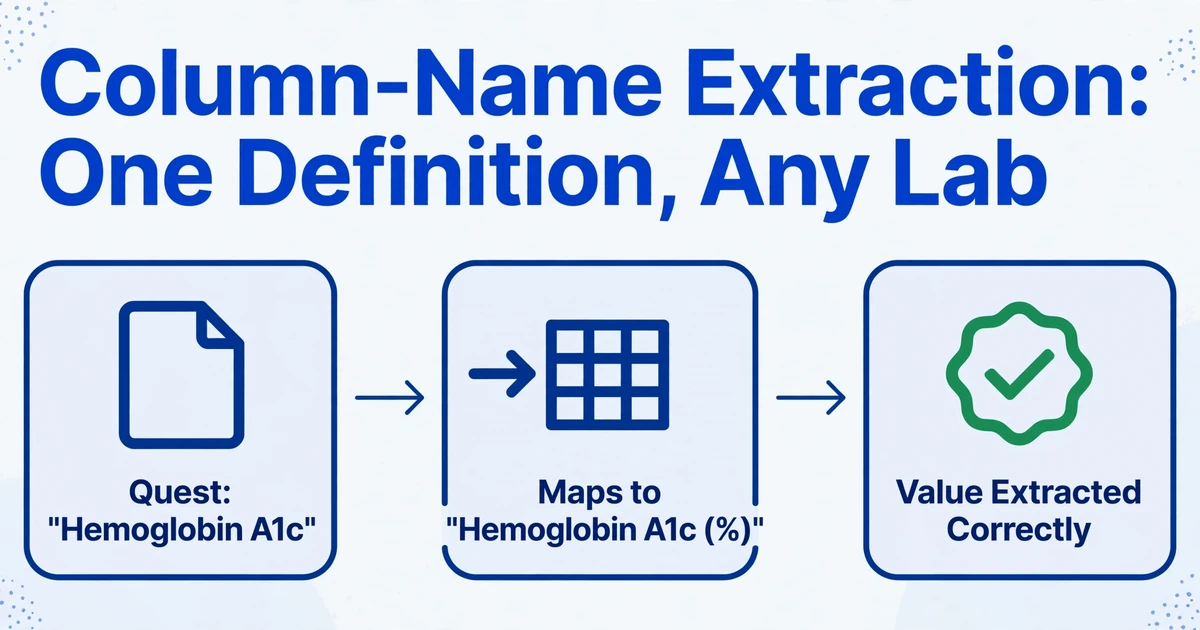
- Template extraction breaks the moment you switch labs because Quest labels the test "Hemoglobin A1c" while LabCorp labels it "HbA1c (%)" and any tool that matches exact strings instead of semantic meaning produces empty cells on contact with your second provider.
- ImageToTable.ai reads lab values by understanding what each test name means regardless of labeling convention — "HbA1c (%)," "A1C," and "Glycohemoglobin" all land in the same column and your role shifts from retyping numbers to verifying them.
Why Patients Keep Typing Lab Results by Hand
The CLL Society's Excel template is not an isolated case. The Barth Syndrome Foundation distributes its own spreadsheet for tracking lab values, with instructions that acknowledge the work involved: "Maintain a spreadsheet of lab results that can be filtered by date and by results." The quantified-self community on Reddit's r/QuantifiedSelf regularly asks for tools that can plot blood test trends over time. Patient communities, chronic disease advocates, and health-conscious individuals all converge on the same workflow: get a PDF from the lab, open it alongside a spreadsheet, and type. It's universal because it's the only free option.
The problem isn't the spreadsheet — the spreadsheet works fine. The problem is what sits between the PDF and the spreadsheet: a human reading values off a page and typing them into cells. For a patient tracking five biomarkers across quarterly blood draws, that's 20 values per year. The typing takes two minutes per report. The real frustration isn't the time — it's that the data is already digital. The lab generated it from a machine. It was transmitted to a database, formatted into a report, and emailed as a PDF. The only non-digital step in the entire chain is the one where you move it from the PDF to your tracking sheet.
But automating that step is harder than it seems, because lab reports are not invoices.
An invoice from Vendor A and an invoice from Vendor B both have line items, totals, and dates — their structure is broadly similar. A lab report from Quest Diagnostics and a lab report from a local hospital share almost no structural DNA. The test name might be in column 1 or row 3. The value might be next to the name or below it. The reference range might be in parentheses on the same line or in a separate column three inches to the right. And the label for hemoglobin A1c might be "Hemoglobin A1c," "HbA1c," "A1C," or "Glycohemoglobin" — all in the same city, all referring to the same test.
What You're Actually Tracking — Test Name, Value, Unit, Reference Range
A lab report contains more information than you need. Patient demographics, ordering physician, specimen collection time, laboratory accreditation, method notes — all relevant to the report's integrity, none relevant to a personal tracking spreadsheet. What you care about fits in five columns:
Test Date | Test Name | Result Value | Unit | Reference RangeEvery other field on the report — the patient's address, the lab's CLIA number, the performing technologist's initials — is noise for tracking purposes. The five columns above are the signal. And the hardest one to extract reliably is Test Name, because different labs describe the same test differently.
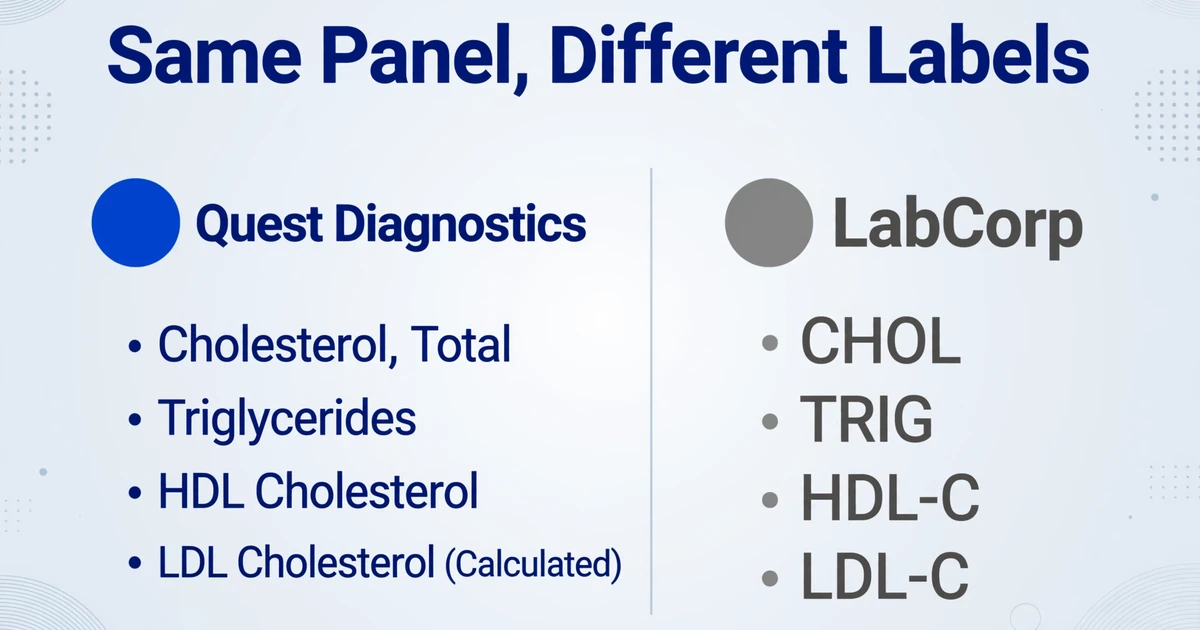
A lipid panel at Quest Diagnostics lists "Cholesterol, Total," "Triglycerides," "HDL Cholesterol," and "LDL Cholesterol (Calculated)." The same panel at LabCorp might list "CHOL," "TRIG," "HDL-C," and "LDL-C." A hospital lab might print them as "Total Cholesterol," "Triglyceride," "HDL," and "LDL." The values are the same numbers. The labels are different strings. A template-based extraction tool trying to find "Cholesterol, Total" on a LabCorp report returns nothing — because "CHOL" isn't "Cholesterol, Total" to a template. It's only the same thing to someone who understands what both labels mean.
This is the core challenge that explains why patient communities still distribute manual Excel templates. If automated extraction were easy with existing free tools, the CLL Society would link to one instead of distributing a spreadsheet that asks patients to type.
How Column-Name Extraction Reads Any Lab Format
The approach that works across different lab reports is column-name extraction: instead of telling the tool where each value sits on the page, you tell it what information you want, and it finds the matching data by understanding what the labels mean. You type the column names into the tool — the same column names that will become your spreadsheet headers:
Test Date  |  Hemoglobin A1c (%)  |  Fasting Glucose (mg/dL)
Total Cholesterol (mg/dL)  |  HDL Cholesterol (mg/dL)  |  LDL Cholesterol (mg/dL)
Triglycerides (mg/dL)  |  TSH (mIU/L)  |  Vitamin D (ng/mL)
When the AI processes a Quest report, it sees "Hemoglobin A1c" printed in the left column and extracts the corresponding value. When it processes a LabCorp report, it sees "HbA1c (%)" — different string, same meaning — and maps it to the same column. When it processes a hospital report that labels the test "糖化血红蛋白" (in Chinese), the AI understands the semantic equivalence. The column name you define is the canonical label, and the AI handles the mapping regardless of how each lab chooses to phrase it.
This is the opposite of template-based extraction, where you'd need to configure a separate template for each lab's report layout. It's also the opposite of raw OCR, which would give you all the text on the page with no understanding of which number belongs to which test. Column-name extraction gives you exactly the values you asked for, organized into exactly the columns you named.
The output arrives as an Excel file with each row representing one report — one blood draw, one date — and each column representing one biomarker. Sort by date to see your HbA1c trend over six months. Create a line chart from the Total Cholesterol column. Flag values outside the reference range with a conditional formatting rule. The spreadsheet is structured for analysis from the moment it's generated, not after an hour of reformatting.
For researchers working with EHR lab panels in clinical studies — including extracting flagged values, disambiguating multi-visit records, and handling system-specific formatting — see our guide on extracting lab values from EHR screenshots. If you're working with mixed document types in a single study, extracting variables across radiology, pathology, and discharge notes covers how to handle multi-source records. For the complete playbook — units, reference ranges, abnormal flags, and batch processing at clinic scale — see our complete guide to lab report data extraction, or if you're organizing results for many patients at once, how small clinics batch-organize patient lab results.
Processing Multiple Reports at Once — A Year of Blood Work in One Batch
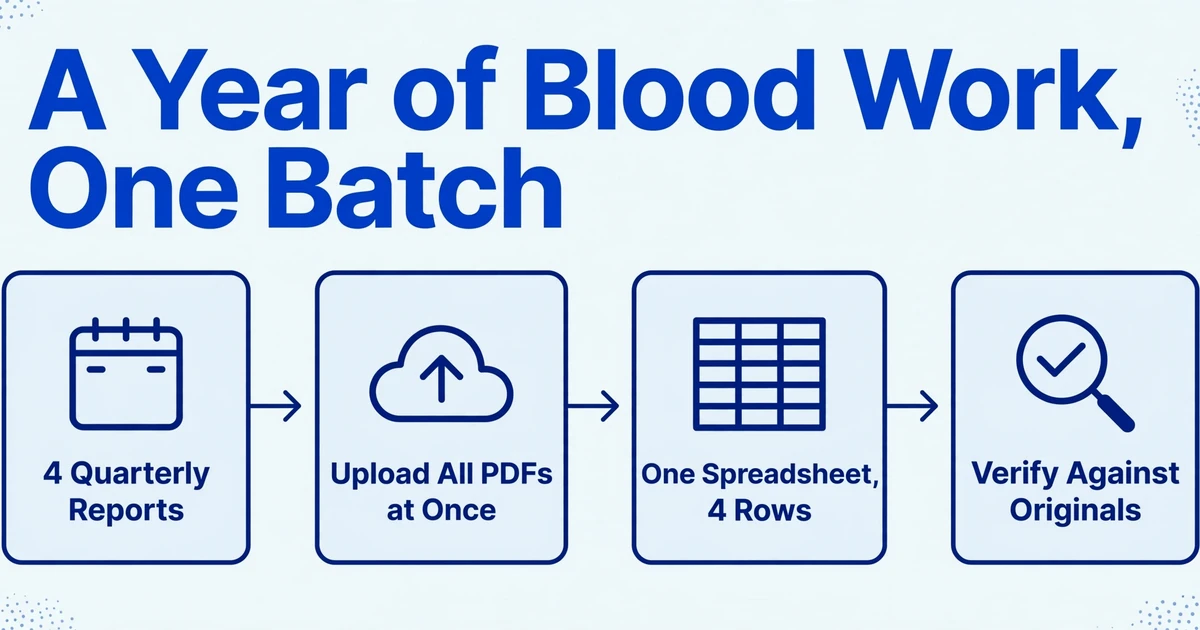
The column-name approach compounds in value when you process multiple reports together. A patient managing a chronic condition might have three or four blood draws per year, each from a different lab or a different location of the same lab network. The reports span a year but take minutes to process in a single batch.
Upload all four quarterly PDFs at once. The AI reads each one independently — the January Quest report, the April LabCorp report, the July hospital lab report, the October Quest report — and maps every result to the same set of columns. The output is one spreadsheet with four rows (one per draw date) and however many biomarker columns you defined. No cutting and pasting between files. No reconciling different column orders. The extraction handles the normalization.
The verification step matters more here than for most document types. A mistyped invoice total is a $50 error. A mistyped lab value could mean missing a trend that warrants a medication adjustment. After extraction, scan the spreadsheet against the original PDFs — verify that the HbA1c value in the spreadsheet matches the value on the report, that the unit (%, mg/dL, mIU/L) is correct, and that values near the edges of reference ranges haven't been transposed. This verification takes under a minute per report and is the point where human judgment belongs in the workflow. The AI eliminates the typing; verification ensures the accuracy.
What the AI Can and Can't Do with Lab Reports
Lab report extraction has boundaries worth stating clearly.
It extracts values, not interpretations. The AI reads "TSH: 4.8 mIU/L" and enters 4.8 in the TSH column. It doesn't tell you that a TSH of 4.8 is borderline high or that your previous value was 2.1. Interpretation belongs to you and your doctor. The spreadsheet is the raw material for that interpretation — consistently formatted, accurately transcribed, ready for analysis.
Scan quality affects accuracy. A crisp PDF generated directly from the lab's LIS (Laboratory Information System) produces highly reliable extraction. A scanned printout — especially one that's been faxed, printed, and scanned again — can introduce artifacts that reduce accuracy on specific values. The numbers most likely to be affected are those with decimal points (which can blur into commas) and values printed in very small font (common on dense metabolic panels). If a value looks wrong during verification, check it against the original.
It won't replace your doctor's review. Lab values exist in context — your age, medications, symptoms, and history all factor into what a given number means. Extraction followed by spreadsheet charting is a supplement to medical care, not a substitute for it. The value of automated tracking is that it makes the data accessible between appointments: you can see a trend forming before it becomes a problem, and you can bring data — not anecdotes — to your next doctor's visit.
FAQ
Can the AI read handwritten notes on lab reports?
Yes, within reasonable limits. If a doctor has written "recheck in 3 months" in the margin, the AI can extract that as a separate note field if you define a column for it. But handwritten lab results — a report that is entirely handwritten rather than printed — are less reliable than printed reports. The vision model reads handwriting, but the accuracy depends on legibility, and medical handwriting is not famous for legibility. For tracking purposes, request a printed copy of results from your provider whenever possible.
Do I need different column names for different labs?
No. You define the column names once — "Hemoglobin A1c (%)", "TSH (mIU/L)", "Vitamin D (ng/mL)" — and the AI maps each lab's labels to your column names automatically. The column name serves as the canonical label, and the AI handles the variation in how different labs describe the same test. This means you can add a new lab or a new report format at any time without reconfiguring anything.
What about lab results in languages other than English?
The AI reads lab reports in any language. A hospital report in Chinese that lists "空腹血糖" (fasting glucose) will map to the "Fasting Glucose (mg/dL)" column you defined. The extraction normalizes across languages the same way it normalizes across different English abbreviations — by understanding what the label means, not by matching the characters.
Can I extract data from lab reports that are images rather than PDFs?
Yes. A photo of a printed lab report taken with a phone — or a screenshot of patient portal results — is processed the same way as a PDF. The vision model reads text directly from images without requiring a separate OCR step. For best results, take the photo straight-on in good light and make sure the values are clearly visible. Cropping tightly to the results section helps, but is not necessary.
Is this suitable for tracking a family member's lab results?
Yes. If you manage healthcare for an aging parent or a child with a chronic condition, the same workflow applies: gather the lab PDFs, define the biomarkers that matter, batch upload, and get a tracking spreadsheet. The Patient Name column distinguishes whose results are whose when multiple family members' reports are processed together. For anyone who has ever sat in a specialist's office trying to remember whether last year's creatinine was 1.1 or 1.3, having a spreadsheet with the actual values — extracted, not recalled — changes the quality of the conversation.