One Study, Three Document Types:
Radiology, Pathology, and Discharge Notes Into One Table
Your oncology retrospective needs tumor size from the radiology report, histology grade from pathology, and length of stay from the discharge summary. For 200 patients, that is three documents each. Three formats, three sets of conventions, one dataset. The data exists; it is scattered across document types that were never designed to be combined.
Key Takeaways
- At 200 patients with three document types each, you'll have opened 600 files before your dataset has a single variable in it: the invisible arithmetic of multi-source chart review.
- The bottleneck isn't how fast you transcribe. It's that every source document was written for a clinical audience (referring physicians, tumor boards, next providers), not for the researcher who needs five variables from all three.
- Define your variables as column names once, from Lesion Size to a derived length of stay, and ImageToTable.ai pulls them from radiology, pathology, and discharge documents in one batch, leaving you a table where each row waits for a simple merge by patient ID.
The Multi-Source Chart Review Problem
Single-document retrospective studies are uncommon. Most studies draw variables from multiple document types within each patient record: labs from the chemistry panel, imaging findings from radiology reports, histological classification from pathology notes, outcomes from the discharge summary. Each document contributes a different slice of the dataset.
The complication is that each document type is structured around the needs of its original author. Radiology reports are written for referring clinicians and structured around anatomical location and clinical impression. Pathology reports follow CAP (College of American Pathologists) synoptic formats for tumor boards and registries. Discharge summaries summarize a hospitalization for the next provider. None of them are structured for a researcher who needs five specific variables across all three.
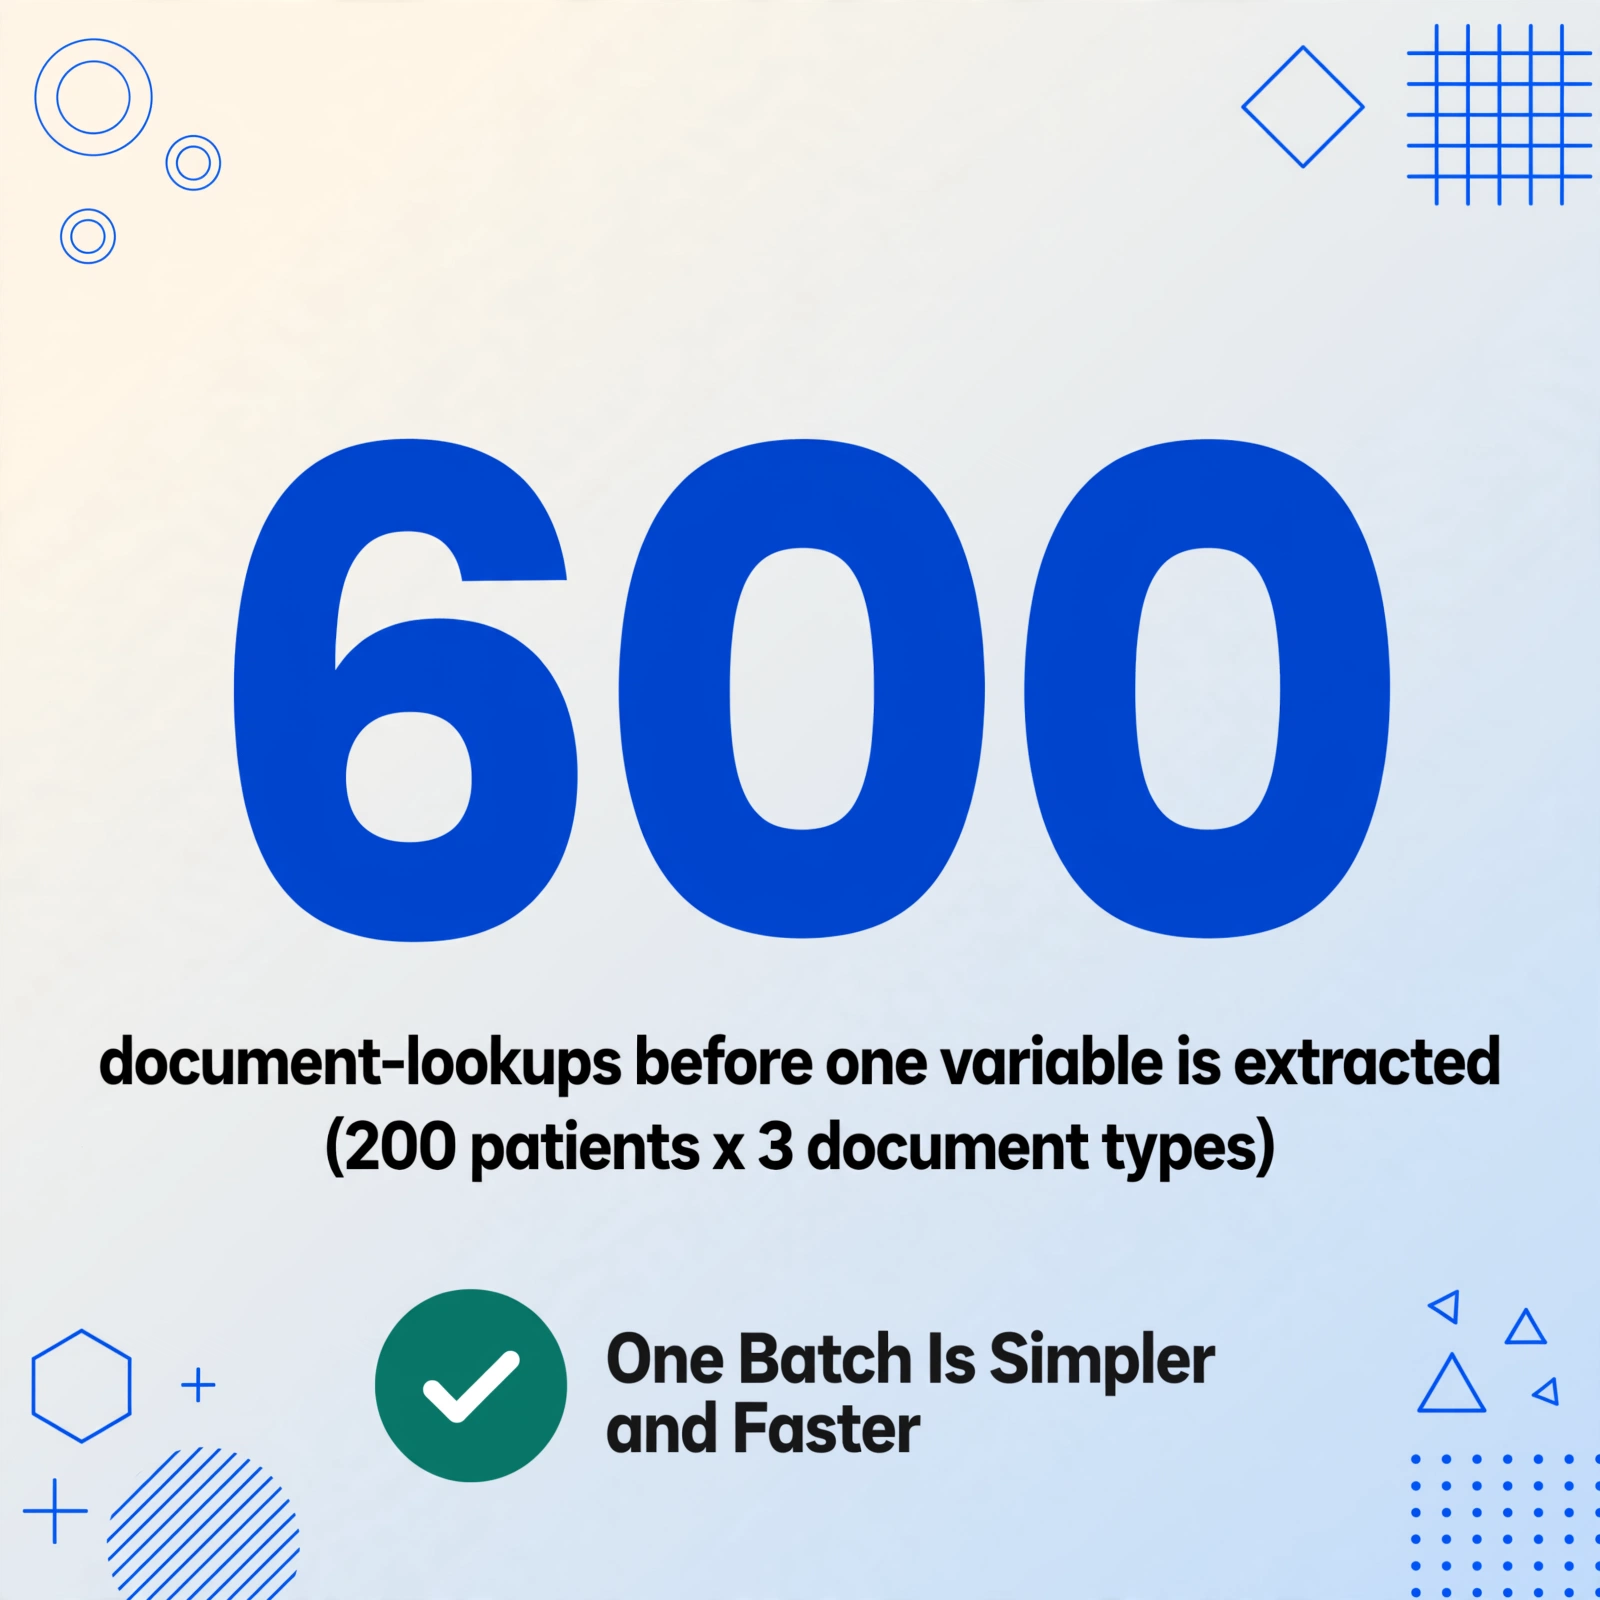
Manual extraction from multi-source records means opening three documents per patient, navigating three different formats, and transcribing from three different locations. At 200 patients, that's 600 document-lookups before you've extracted a single variable.
Radiology Reports: Findings Buried in Prose
Radiology reports follow a loose standard: Clinical History, Technique, Findings, Impression. The Findings section is narrative prose: a radiologist's description of what was seen, written for clinical interpretation rather than database entry. The variables researchers need (tumor size, location, staging implications) are embedded in paragraphs like:
FINDINGS: There is a 2.3 x 1.8 cm hypoechoic lesion in the right hepatic
lobe, segment VI, with peripheral enhancement on contrast-enhanced phases
consistent with HCC. No satellite lesions identified. Portal vein appears
patent. No ascites.

IMPRESSION: 2.3 cm hepatocellular carcinoma, right lobe segment VI.
No vascular invasion. Li-RADS 5.
The variable you need (lesion size: 2.3 cm) is in there, but so is anatomical context, imaging technique qualifiers, and the radiologist's interpretive language. That gap is what makes radiology report extraction harder than it looks: plain OCR returns all of it, while column-based extraction returns just the value you asked for.
Useful column names for radiology reports:
| Column name | Extracts from radiology report |
|---|---|
| Lesion Size | Primary lesion dimensions (largest diameter, or longest × shortest) |
| Lesion Location | Anatomical site and sub-location (lobe, segment, quadrant) |
| Vascular Invasion | "Yes," "No," or blank if not mentioned |
| Lymph Node Status | Positive, negative, or number of involved nodes |
| Radiologic Staging | TNM, Li-RADS, BIRADS, or equivalent system's score |
| Imaging Modality | CT, MRI, PET-CT, Ultrasound, etc. |
Pathology Reports: Semi-Structured but Inconsistent
Pathology report data is semi-structured, which should make it the easiest of the three document types to extract. Surgical pathology reports for resected tumors follow CAP synoptic formats with explicit labeled fields: Histologic Type, Grade, Tumor Size, Margins, Lymphovascular Invasion, Perineural Invasion, Stage. These labeled fields extract reliably.
The inconsistency comes from two sources: older reports that predate widespread synoptic adoption (narrative pathology notes rather than labeled fields), and reports from different institutions that use slightly different synoptic templates. A breast pathology report from Hospital A may list "Nuclear Grade" while Hospital B uses "Nottingham Grade", both names for the same classification system.
Column names that map to common pathology report fields:
| Column name | Extracts from pathology report | Notes |
|---|---|---|
| Histologic Type | Primary tumor classification (e.g. Invasive Ductal Carcinoma) | Handles variant names and abbreviations |
| Grade | Histologic grade (I/II/III, low/intermediate/high, Nottingham score) | Specify grading system if mixed: "Nottingham Grade" |
| Tumor Size (Pathologic) | Largest dimension of resected specimen | Distinct from radiologic size, so use separate columns for both |
| Margin Status | Negative, positive, focally positive, or distance to margin | May appear as "Margins: Clear" or numerical distance |
| Lymphovascular Invasion | Present, absent, or not identified | LVI, LVSI, or lymphovascular space invasion variant labels |
| Pathologic Stage | pTNM stage from synoptic report | Distinct from clinical staging, so specify "Pathologic Stage" |
Discharge Summaries: Labeled But Verbose
Discharge summaries are the most researcher-friendly of the three document types. They typically have clearly labeled sections (Admission Date, Discharge Date, Admitting Diagnosis, Discharge Diagnosis, Procedures, Disposition) that map cleanly to database fields. The challenge is verbosity: the narrative sections (Hospital Course, Assessment and Plan) can run to several paragraphs, making full-text processing expensive and imprecise.
The structured fields extract reliably. The variables buried in the Hospital Course narrative (e.g., "required ICU transfer on hospital day 3," "developed acute kidney injury") require more specific column naming:
| Column name | Extracts from discharge summary |
|---|---|
| Admission Date | Index admission date |
| Discharge Date | Date of discharge |
| LOS | Length of stay (days); calculated or explicitly stated |
| Primary Diagnosis | Admitting or principal diagnosis (ICD code or description) |
| Discharge Disposition | Home, SNF, rehab, expired, AMA, transfer |
| 30-Day Readmission | Mentioned or documented within summary context |
| Procedures Performed | Surgical or procedural interventions listed |
One Batch Upload, One Output Table
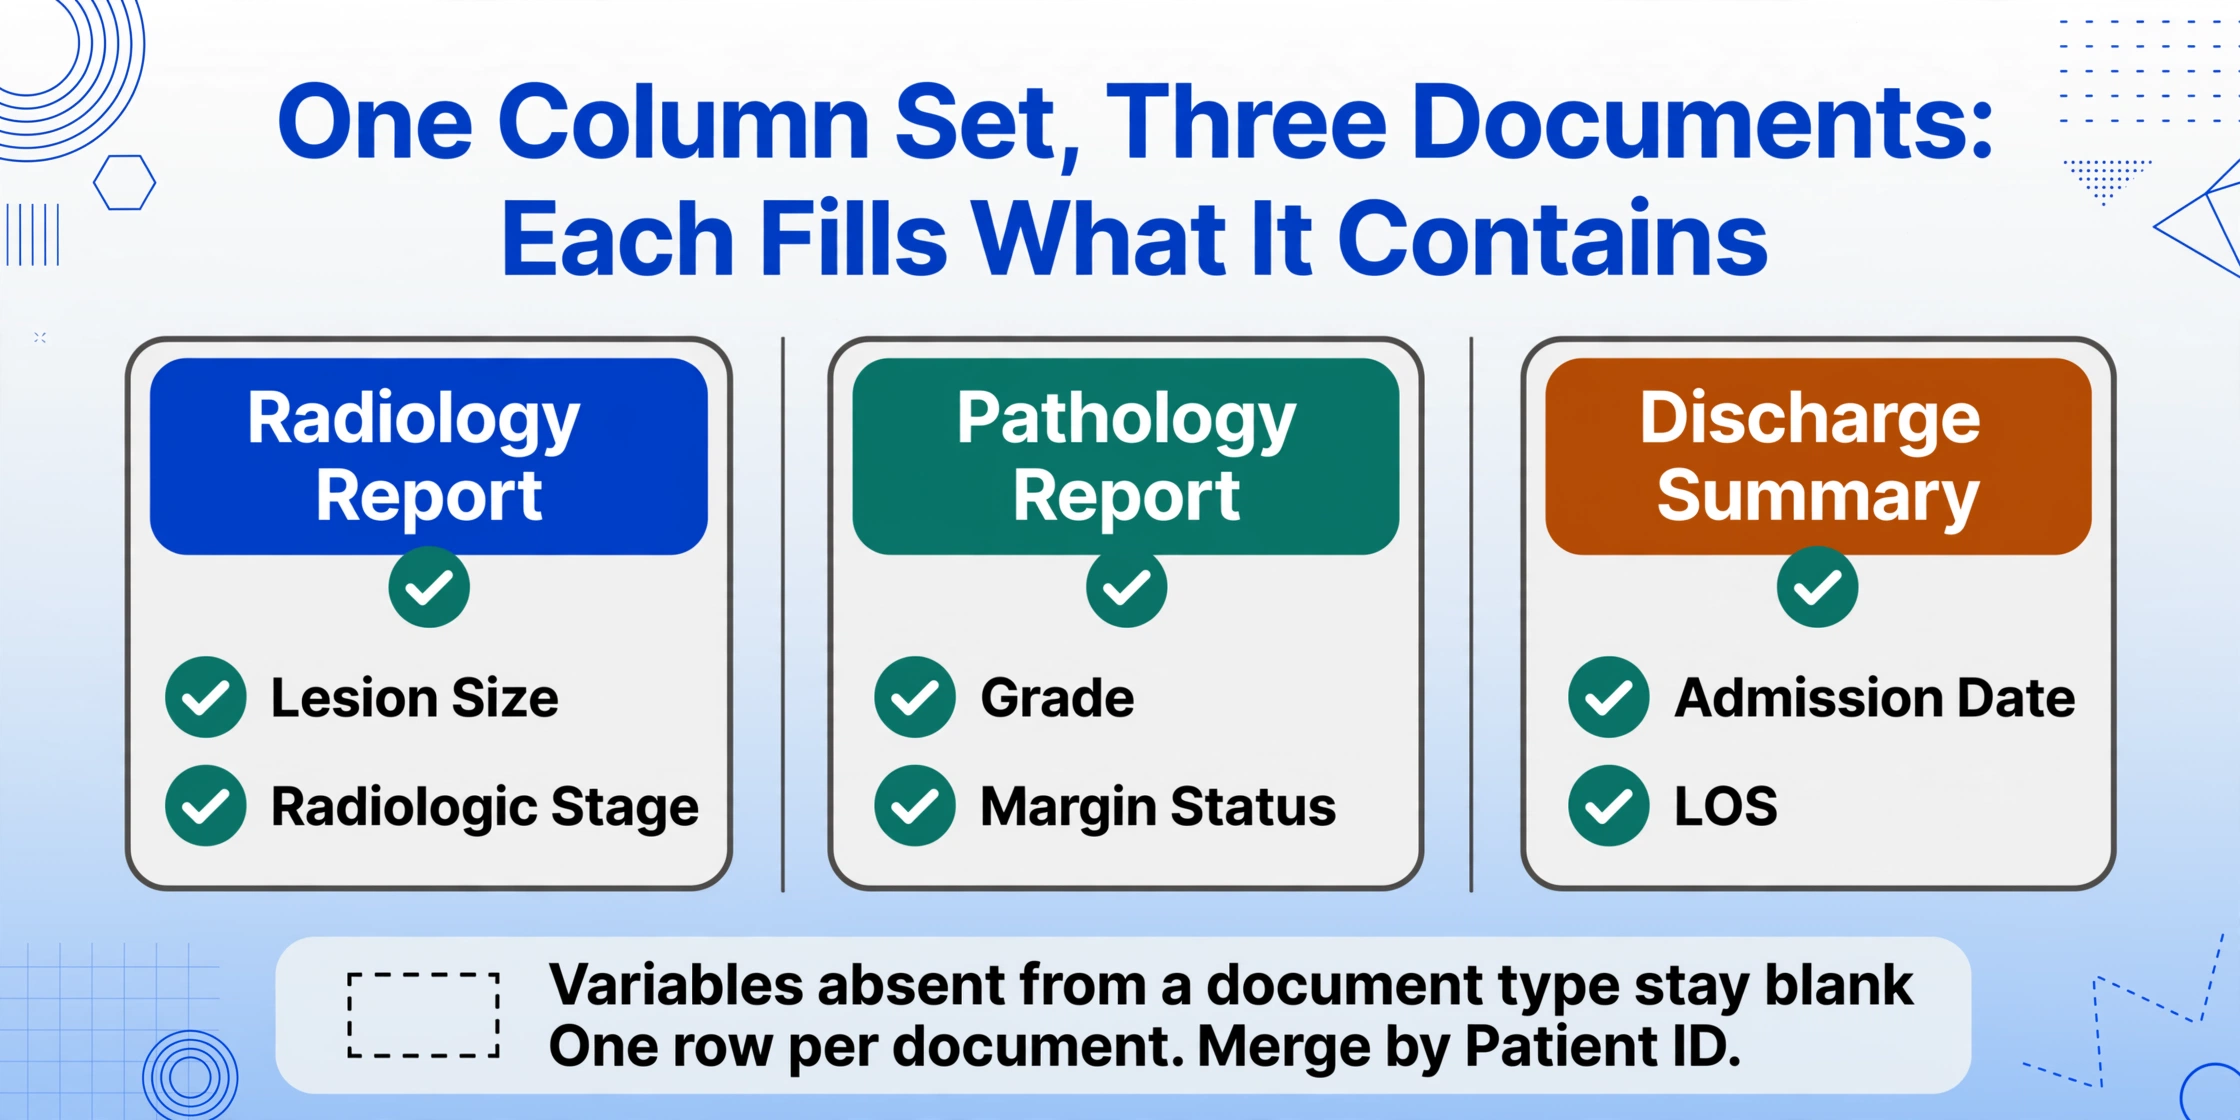
With ImageToTable.ai, you don't need to process document types separately. Upload radiology reports, pathology notes, and discharge summaries together in a single batch. Define a column set that covers all three document types:
Lesion Size | Radiologic Stage | Histologic Type | Grade | Margin Status |
Admission Date | LOS | Discharge Disposition | Primary Diagnosis
Each document contributes the variables it contains. A radiology report fills in Lesion Size and Radiologic Stage; the pathology report fills in Grade and Margin Status; the discharge summary fills in Admission Date and LOS. Variables absent from a particular document type are left blank for those rows.
Column names can also carry a calculation, so a derived variable arrives as a normal column instead of something you work out by hand in Excel. A column named "LOS (Days Between Admission and Discharge)" returns length of stay even when the summary never states it, and "Age at Diagnosis" can be derived from a date of birth and a diagnosis date that sit on two different documents. Anything your protocol defines as a derived variable is named the same way as a directly extracted one.
In your output table, each row represents one document, not one patient. You'll need to merge by patient ID after extraction, which is a straightforward VLOOKUP or merge operation once all three document types are in spreadsheet form. Naming your files consistently (e.g., PatientID_radiology.pdf, PatientID_pathology.pdf) makes this merge step fast.
Spot-Checking Multi-Source Datasets
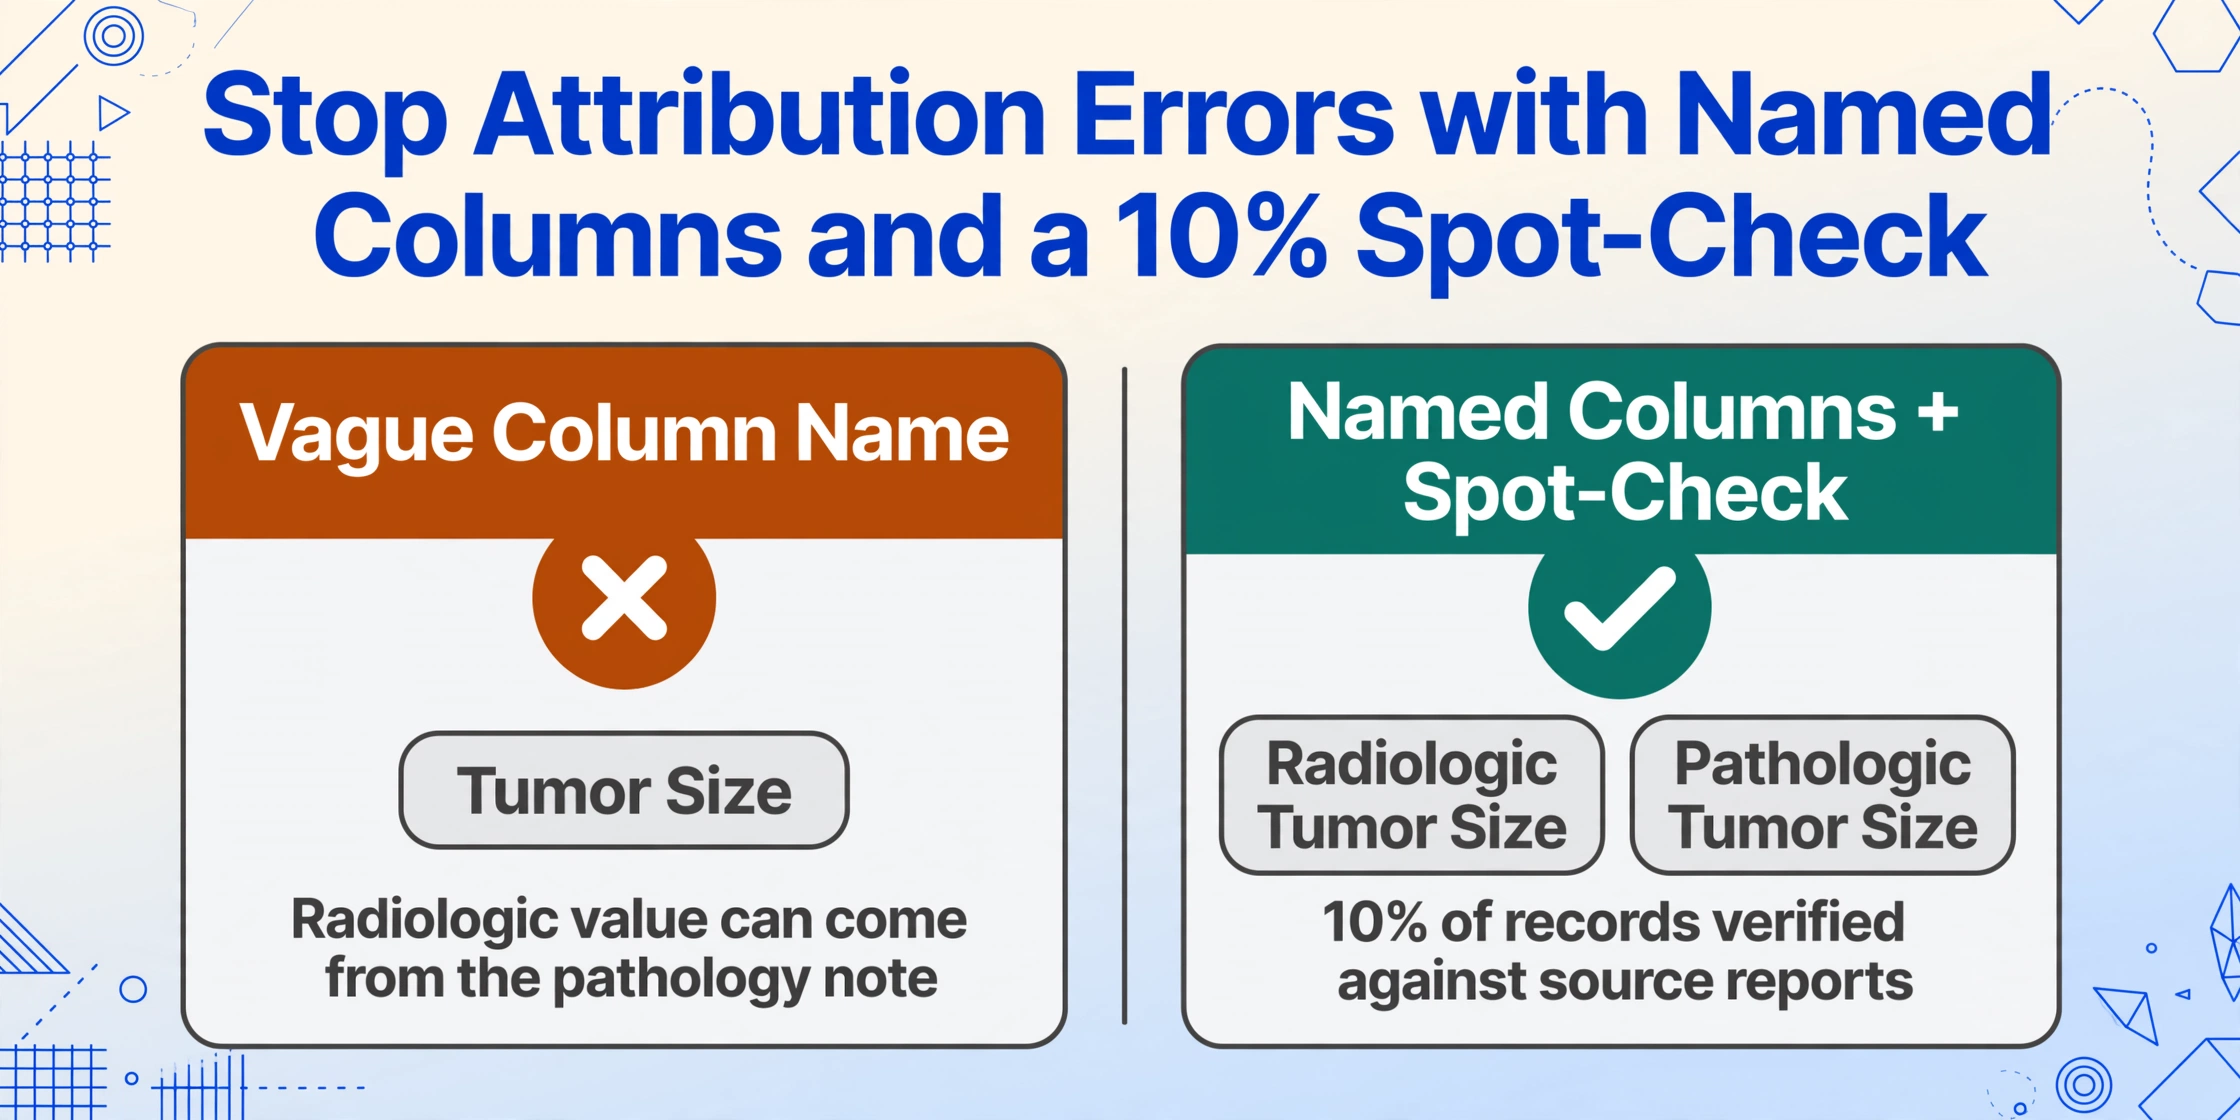
Multi-source extraction has one category of error that's specific to complex records: variable attribution. The model may occasionally extract a radiologic tumor size from the pathology report (which quotes the imaging finding in its clinical history section) rather than from the pathology specimen measurement. These cross-document references are a real feature of clinical reports, and they can create subtle errors in studies that need to distinguish between radiologic and pathologic dimensions.
The practical fix is precise column naming ("Radiologic Tumor Size" vs. "Pathologic Tumor Size") and a targeted spot-check: after extraction, take 10% of your records and verify the specific cross-document variables against source reports. This catches attribution errors without requiring full re-verification of every row.
Review Mode makes that spot-check faster. Open a record, hover or click any extracted cell, and the tool highlights exactly where that value sits on the original page; click a highlighted region and it jumps back to the matching table cell. For attribution errors specifically, you can see at a glance whether "Radiologic Tumor Size" was read from the radiology Findings section or from a pathology note quoting the imaging study, without re-reading either report end to end.
Before You Upload: Where the Data-Governance Line Falls
Clinical records carry a rulebook that has nothing to do with how good your extraction is. Under the HIPAA Privacy Rule, data stripped of the 18 Safe Harbor identifiers (names, medical record numbers, full dates of service, and the rest) is no longer protected health information; identifiable data still is. If your source files carry identifiers, every tool that touches them, including this one, has to sit inside your institution's approved data-handling framework, and a vendor that creates, receives, or transmits that data on your behalf generally needs a Business Associate Agreement in place.
ImageToTable.ai processes uploaded files ephemerally and does not retain them after extraction, but that alone does not settle the question for your study. Confirm two things before a real batch: that your IRB protocol and data-governance office permit the files to leave your systems, and that each tool in your pipeline touching patient data is covered by the agreements your institution requires. The technical-safeguard requirements for electronic PHI live in 45 CFR Part 164, Subpart C, and your privacy officer will know how they apply to a retrospective review.
Frequently Asked Questions
Can I upload all three document types for a patient in the same batch, or do I need separate runs?
You can upload everything in one batch. The tool processes each document independently. A radiology report and a discharge summary from the same patient are handled as separate images, each producing its own row. You merge them by patient ID in Excel after extraction. There's no benefit to separating runs by document type; one batch is simpler and faster.
My pathology reports follow two different synoptic formats from two different hospitals. Does that affect extraction?
In most cases, no. Synoptic pathology reports use labeled fields, for example "Histologic Type:" followed by the value, even when the specific template varies between institutions. The model reads the label and extracts the corresponding value, regardless of where that label appears on the page. Significant layout differences between institutions are handled correctly for most labeled fields. For narrative-only pathology reports (older documents without synoptic structure), accuracy depends on how clearly the pathologist described the relevant findings.
Radiology reports sometimes contain multiple lesion measurements. How do I specify which one I want?
Be specific in your column name. "Primary Lesion Size" vs. "Largest Lesion Size" vs. "Target Lesion Size" give the model different extraction targets when multiple measurements appear. If your study protocol specifies a particular lesion (e.g., the dominant hepatic lesion), include that context in the column name: "Dominant Hepatic Lesion Size." More specific column names reduce ambiguity and improve consistency across records.
What's the best way to handle PDFs vs. screenshots for these document types?
PDF exports from EHR systems typically produce cleaner input than screenshots: higher resolution, no screen glare, and machine-generated text rather than rendered pixels. If your institution provides PDF export for radiology and pathology reports, use those. Screenshots work well when PDF export isn't available or when you're working from photos taken during a records review session at a hospital. Both formats are supported in the same batch.
I need to distinguish clinical TNM staging from pathologic TNM staging. Can I extract both?
Yes. Use two separate columns: "Clinical Stage (cTNM)" and "Pathologic Stage (pTNM)." The model distinguishes between pre-treatment clinical staging (typically from the radiology report or oncology note) and post-resection pathologic staging (from the pathology report). Naming both explicitly in your column set extracts both values correctly when they appear in different documents for the same patient.
Try it with a sample patient set: upload the radiology, pathology, and discharge documents together and define your research variables as column names.
Start Extracting