The Real Cost of Chart Review:
Extraction Hours, Not Analysis
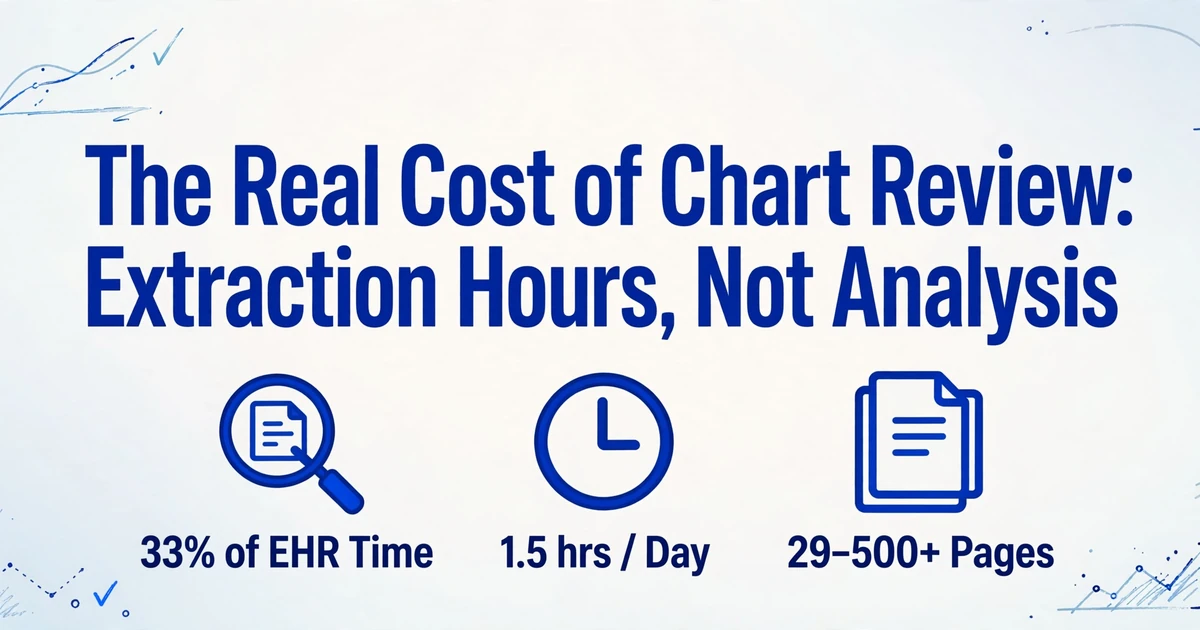
In 2020, researchers at Cerner Corporation analyzed 100 million patient encounters across 155,000 U.S. physicians. Their finding: the average doctor spends 16 minutes and 14 seconds in the electronic health record per patient encounter. A third of that time — 5 minutes and 22 seconds — goes to chart review alone. Multiplied by a typical 20-patient day, that's nearly two hours spent scrolling through clinical notes, hunting for specific values, and piecing together a patient's history from records that can span 500 pages.
But here's what the aggregate numbers don't show: most of those 5 minutes and 22 seconds aren't clinical reasoning. They're clerical work — locating a lab value from three months ago, finding the last ejection fraction, checking whether a medication was discontinued. The actual clinical judgment — the synthesis, the pattern recognition, the decision — fits into a fraction of that time. This article separates the two, and puts a dollar figure on the gap.
The Average Physician Spends 5 Minutes 22 Seconds Reviewing a Chart Per Patient — but That Number Hides the Real Cost
The Cerner study, published in the Annals of Internal Medicine, is the largest EHR time-use analysis ever conducted: 100 million encounters, 155,000 physicians across 400 health systems. Its top-line number — 16 minutes 14 seconds of EHR time per encounter — has been widely cited. What's less discussed is the internal breakdown.
Of those 16 minutes, 33% went to chart review — specifically, reading prior notes, lab results, imaging reports, and consultant documentation to understand the patient before deciding anything. That's the second-largest time category after clinical documentation (24%), and it's the one task that simply cannot be skipped: you cannot treat a patient whose history you haven't read.
A separate 2024 AMA study of over 200,000 ambulatory physicians, led by Christine Sinsky, MD, found that across all specialties, physicians spend 5.8 hours on the EHR for every 8 hours of scheduled patient time. A Frontiers in Digital Health review (Lee et al., 2024) quantified the chart review slice more precisely: physicians spend approximately 1.5 hours per day on chart review alone, and U.S. medical residents log 112 hours per month exclusively reading patient records. For primary care physicians — the specialty that tops every EHR burden study — a JAMA Network Open analysis (2024) found a median of 36.2 minutes of EHR time per visit for 30-minute appointment slots, with 6.2 minutes of that happening after hours.
The time number is established. The cost number — what it means in dollars once you separate clerical extraction from clinical reasoning — is what nobody has published.
The Extraction-Versus-Analysis Split: Most Chart Review Time Is Clerical, Not Clinical
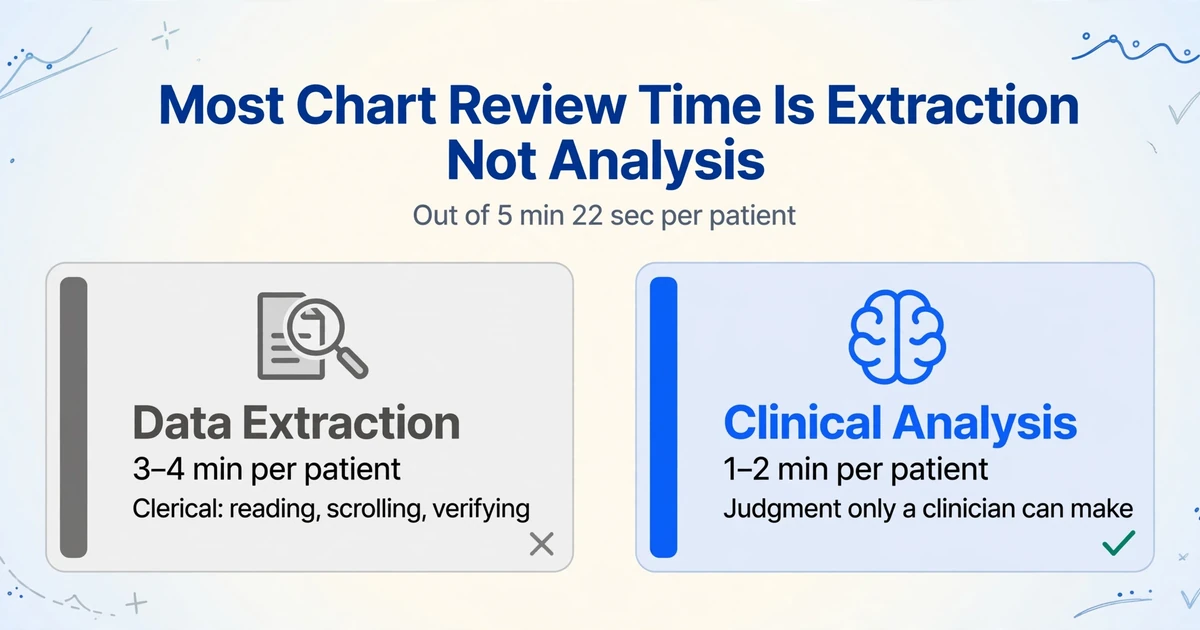
"Chart review" as an activity category lumps together two fundamentally different cognitive tasks. Understanding the distinction is the key to knowing where automation can actually help — and where it can't.
Data extraction — locating specific facts in the record — is clerical work performed by a clinician: finding the most recent hemoglobin A1c, checking whether the patient had a colonoscopy in the past 10 years, pulling the last three blood pressure readings from separate visits, identifying which medications were stopped and when. The clinician isn't forming a medical judgment during these steps. They're hunting and gathering — scanning pages, cross-referencing dates, verifying that the number they found is the right one.
Clinical analysis — synthesizing those facts into a medical decision — is the work only a trained clinician can do: recognizing that the A1c trend plus the medication history plus the creatinine level together suggest the treatment plan needs adjustment. This is pattern recognition across variables, informed by years of training.
The problem is the ratio. A Frontiers review noted that patient records can range from 29 to over 500 pages, and that "note bloat" — the gradual lengthening of clinical documentation — has increased average note length by 60% over the past decade. As records get longer, the extraction component swells while the analysis component stays constant. The clinician ends up spending more time digging and less time deciding.
One family medicine case study cited in the Frontiers review found that 29% of medical errors were associated with patient information processing — availability of information within charts, physician-to-physician communications, and clinical knowledge gaps. This isn't a failure of clinical judgment. It's a failure of information retrieval: the right data existed somewhere in the chart, but the clinician couldn't find it in the time available.
The average 5 minutes and 22 seconds per patient breaks down into roughly 3-4 minutes of extraction and 1-2 minutes of analysis. The clinical judgment — the part that justifies a medical degree — occupies less than half of what we call "chart review."
| Chart Review Task | Type | Time per Encounter | Who Can Do It |
|---|---|---|---|
| Find most recent A1c / lab values | Extraction (clerical) | 30-60 seconds | AI or trained assistant |
| Review medication list for changes | Extraction (clerical) | 30-45 seconds | AI or trained assistant |
| Check specialist consult notes for key findings | Extraction (clerical) | 60-120 seconds | AI or trained assistant |
| Verify prior imaging / procedure dates | Extraction (clerical) | 30-60 seconds | AI or trained assistant |
| Reconcile history across multiple facilities | Extraction (clerical) | 60-120 seconds | AI or trained assistant |
| Synthesize findings into clinical assessment | Analysis (clinical) | 45-90 seconds | Clinician only |
| Formulate treatment plan / next steps | Analysis (clinical) | 30-60 seconds | Clinician only |
The bottom three rows are medicine. The top five are data entry — performed by someone with a medical degree, at a medical degree's hourly cost.
Chart Abstraction: The Hidden Cost Center Most Health Systems Never Measure
Clinical chart review for direct patient care is only half the story. The parallel — and more expensive — activity is clinical data abstraction: the structured extraction of specific data points from patient records for quality registries, clinical research, and regulatory compliance.
Unlike chart review for care — where the clinician reads, understands, and moves on — abstraction requires transcribing findings into structured fields: diagnosis codes, procedure dates, lab values, adverse event classifications. Every data point must be located in unstructured clinical notes, verified, and entered into a registry or research database. The abstractor isn't forming a diagnosis; they're performing manual data entry at clinical complexity.
The numbers are stark:
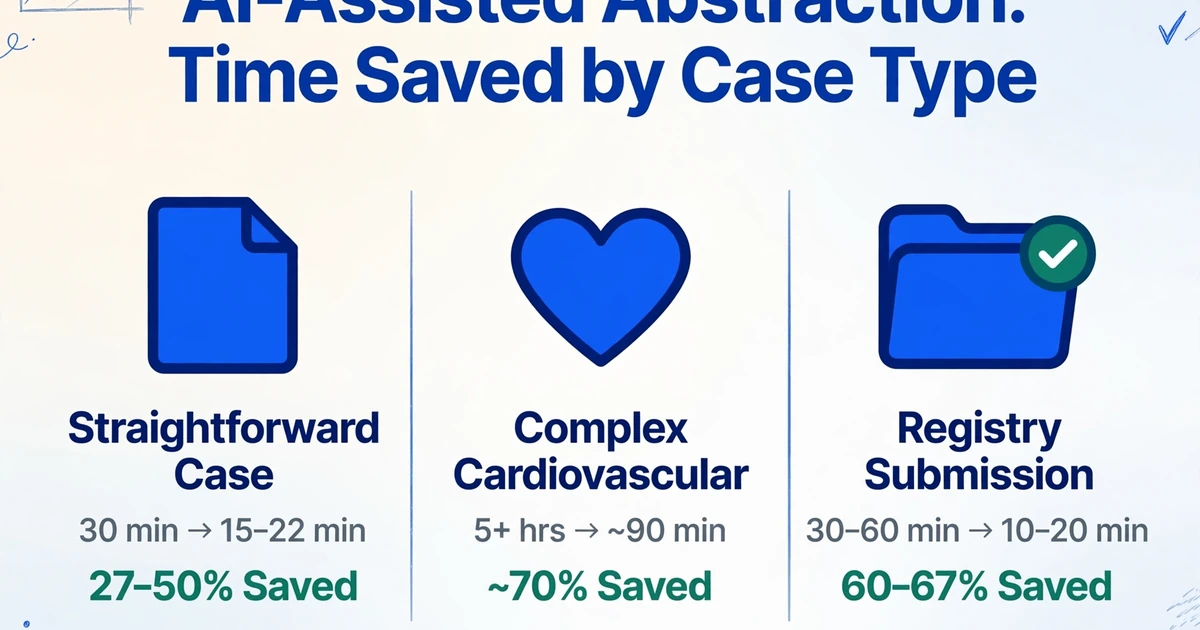
- A nurse abstractor writing on KevinMD in January 2026 described her workflow: a straightforward case took 30 minutes of manual abstraction. A complex cardiovascular case could take 5 hours or more. With AI assistance, those numbers dropped to 15-22 minutes and 90 minutes respectively — but the manual baseline is the status quo at most institutions.
- Health Elements AI reports that a medium-sized health system can spend over $15 million per year on clinical data abstraction across all service lines.
- The Brim Analytics blog notes that one retrospective study estimated it would take 8 to 25 full-time staff to capture just one type of cancer recurrence at a single hospital.
- A Carta Healthcare survey (August 2024) of clinical data abstractors found that 3 out of 5 are neutral to very dissatisfied in their roles, with 70% reporting errors or discrepancies resulting from manual abstraction — and 20% saying it happens "very often."
The workforce behind this is predominantly nurses and coders. A PMC study on abstraction practices found that 41% of abstractors are coders, 27% are nurses. The average nurse abstractor earns approximately $48/hour ($99,700/year) according to ZipRecruiter data, with experienced abstractors at major hospitals earning upward of $121,000/year (Glassdoor). The fully loaded cost — salary plus benefits, taxes, and management overhead — runs 125-140% of base salary, per American Data Network's analysis.
Meanwhile, on Reddit's r/EpicEMR, a surgical research team recently posted: "Our team is desperate to escape the Excel grind so we can focus on the research itself instead of data entry." They described extracting signs, symptoms, and post-operative complications from free-text clinical notes in Epic — findings "buried in clinical notes from follow-up visits" that "must be read and interpreted one by one." The post has one upvote and no good answers.
When the people who generate healthcare's most important data are describing their work as "the Excel grind," the process has a name: it's being performed by the wrong tool.
What AI-Assisted Extraction Changes — and What It Doesn't
AI document extraction doesn't replace clinical judgment. It replaces the hunt-and-transcribe step: the minutes spent finding the right note, scrolling to the relevant paragraph, reading through boilerplate to locate the one sentence that contains the ejection fraction, and typing it into a form.
In AI-assisted abstraction workflows — the type used by tools like Health Elements' Carbon platform, Brim Analytics, and Carta Healthcare's Lighthouse — the AI reads the unstructured clinical note, identifies relevant data points, and presents them to the human abstractor for verification. The abstractor's role shifts from "finder and transcriber" to "reviewer and validator." The clinical judgment stays with the human. The clerical labor moves to the machine.
What this means in practice, based on the KevinMD nurse abstractor's experience:
| Case Type | Manual Abstraction | AI-Assisted | Time Saved |
|---|---|---|---|
| Straightforward case | 30 minutes | 15-22 minutes | 27-50% |
| Complex case (cardiovascular) | 5+ hours | ~90 minutes | ~70% |
| Registry submission (per chart) | 30-60 minutes | 10-20 minutes | 60-67% |
For clinical chart review — the pre-visit preparation that physicians do — the dynamic is similar but the toolset is different. Navina, an AI platform that synthesizes patient data before visits, reported that physicians using it saw a 40% reduction in chart review time, saving an average of 9 minutes per visit in preparation time, according to a study by Phyx Primary Care cited by the American Academy of Family Physicians.
A note on HIPAA. Any AI tool processing patient data must operate under a Business Associate Agreement (BAA) if it handles Protected Health Information (PHI). The HIPAA Safe Harbor method defines 18 identifiers that must be removed for data to be considered de-identified. For chart review and abstraction use cases where data leaves the EHR for processing, covered entities need to confirm that the vendor provides a BAA and that data handling complies with the HIPAA Privacy Rule. This is not an obstacle — it's a checkbox. The major abstraction platforms all provide BAAs. But it's a checkbox that cannot be skipped.
A Quarterly Cost Comparison: Manual Extraction vs. AI-Assisted Workflow
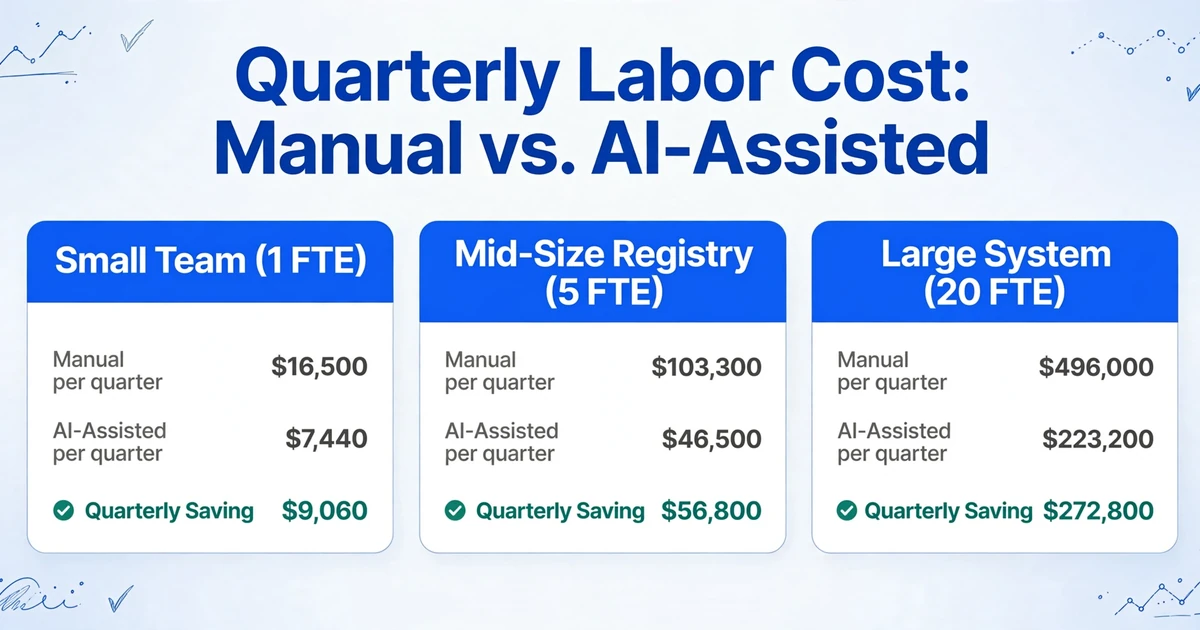
The data above is interesting. What makes it actionable is a dollar figure. Below is a bottom-up quarterly labor cost model for three organizational scales. All calculations use a fully loaded nurse abstractor cost of $62/hour ($48/hour base × 1.3 for benefits and overhead).
| Metric | Small Research Team (1 FTE, ~400 charts/quarter) | Mid-Size Registry Program (5 FTEs, ~2,500 charts/quarter) | Large Health System (20 FTEs, ~12,000 charts/quarter) |
|---|---|---|---|
| Avg manual time per chart | 40 min (mixed complexity) | 40 min (mixed complexity) | 40 min (mixed complexity) |
| Quarterly labor hours | 267 hours | 1,667 hours | 8,000 hours |
| Quarterly labor cost | $16,500 | $103,300 | $496,000 |
| Avg AI-assisted time per chart | 18 min (55% reduction) | 18 min (55% reduction) | 18 min (55% reduction) |
| Quarterly labor hours (AI-assisted) | 120 hours | 750 hours | 3,600 hours |
| Quarterly labor cost (AI-assisted) | $7,440 | $46,500 | $223,200 |
| Quarterly savings | $9,060 | $56,800 | $272,800 |
| Annual savings | $36,240 | $227,200 | $1,091,200 |
A few things to note about these figures:
They're conservative. The 55% time reduction is on the low end. Health Elements reports up to 90% abstraction time reduction for some use cases. Brim Analytics reports 75%+. A 55% assumption is deliberately cautious — and still produces six-figure annual savings at the mid-size level, seven-figure at the large health system level.
They exclude second-order savings. Faster abstraction means registry submissions hit deadlines without overtime or contractor costs. Fewer errors mean less rework and fewer audit findings. Abstractors who review instead of transcribe have lower burnout and turnover — and replacing a nurse abstractor costs an estimated 87 days from posting to hire (American Data Network).
For clinical chart review specifically, the AMA estimates that family physicians spend 1.4 hours of every 8-hour session entering orders — a task that could be delegated. Returning even half of those 1.5 daily chart review hours to direct patient care translates to roughly 3 additional patient visits per day, or about $112,500 in additional annual revenue per physician at a conservative $150 per visit, 250 patient-care days per year.
The Bottom Line
A mid-size health system with 5 full-time abstractors and 50 physicians spends roughly $227,000 per year on abstraction labor and loses $5.6 million in potential clinical revenue to chart review hours that could be patient-facing. AI-assisted extraction addresses both halves of the equation — the abstraction budget line and the clinical capacity constraint — for a combined impact that's orders of magnitude larger than the tooling cost.
Frequently Asked Questions About Chart Review Time
Does the 5:22 per patient chart review time include pre-visit preparation or only during-visit time?
The Cerner study measured active EHR interaction time during patient encounters — the time physicians spent logged in and navigating records during or immediately around the visit window. It does not include pre-charting done hours or days before, nor the "pajama time" spent finishing chart reviews at home. The AMA's Sinsky study found physicians spend an additional 1.2 hours per day on EHR tasks outside scheduled hours, and primary care physicians average 6.2 minutes of after-hours EHR time per visit. The 5:22 is the floor, not the ceiling.
Can AI actually understand clinical notes well enough to extract data accurately?
Modern large language models trained on clinical text can identify diagnoses, medications, lab values, procedures, and dates from unstructured notes with high accuracy — but they are not infallible. A study in npj Health Systems (2025) evaluating AI chart review found that LLM-generated summaries omitted clinically relevant information in 47% of emergency department cases in one retrospective evaluation. This is why the current best practice is AI-assisted abstraction with human verification — sometimes called "human-in-the-loop" — rather than fully autonomous extraction. The AI does the finding; the human confirms the finding. The time savings come from not having to do the finding yourself. The recent nurse abstractor's KevinMD account describes exactly this workflow: "I could validate what the system found rather than manually hunting for data."
Does AI chart review work with handwritten clinical notes?
It depends on the handwriting quality and the AI engine. Current vision-language models can extract text from clear, structured handwriting (printed forms filled by hand, legible clinical notes). Highly cursive, heavily abbreviated physician handwriting — the stereotype exists for a reason — remains challenging. For typed clinical notes, structured EHR fields, and scanned typed documents, extraction accuracy is substantially higher. The technology is improving rapidly, but handwritten clinical notes remain the hardest input type for any AI extraction system.
What's the difference between chart review for patient care and chart abstraction for registries?
Chart review for patient care is a qualitative reading activity — the clinician reads the record to form a clinical understanding and make treatment decisions. Chart abstraction is a structured data extraction activity — the abstractor identifies specific, predefined data points (diagnosis codes, procedure dates, lab values matching registry criteria) and transcribes them into a database. Chart review answers "what should I do for this patient?" Chart abstraction answers "did this case meet the registry inclusion criteria for measure X?" They share the same bottleneck — finding data in unstructured notes — but serve different downstream purposes. AI-assisted extraction accelerates both.
Is it HIPAA-compliant to use AI for chart review and data extraction?
Yes, provided the AI vendor signs a Business Associate Agreement (BAA) with the covered entity and implements appropriate safeguards for Protected Health Information. Under HIPAA, covered entities can use AI to process PHI for treatment, payment, and healthcare operations purposes. For uses beyond these categories — such as research datasets shared outside the institution — data must be de-identified per the HIPAA Safe Harbor method (removing 18 specified identifiers) or Expert Determination. The major clinical abstraction platforms and EHR-integrated AI tools all offer BAAs as standard practice. This is a vendor-selection criterion, not a regulatory barrier.
Files are processed securely and not stored. For PHI, ensure your organization has a BAA in place.