50 Japanese Purchase Orders, One
Procurement Dashboard
A procurement department receiving 50 supplier purchase orders (発注書, hatchūsho) per month typically ends up with one accurate spreadsheet and four unanswered questions. The spreadsheet has one row per PO — PO number, supplier, item, quantity, unit price, line total, delivery date, payment terms (支払条件), consumption tax classification (消費税区分) — faithfully typed from each PDF. The four questions the procurement manager actually needs to answer: how much am I spending with each supplier, which deliveries are due this week, what is my consumption tax exposure by rate category, and how much cash goes out on each settlement day (締日, shimebi). A flat list of fifty rows answers none of these without a pivot table. A columnar dashboard — where the same data is grouped, sorted, and subtotalled by the dimension that answers each question — requires the data to be structured in columns that a formula can read. The gap between a list and a dashboard is not an Excel feature. It is that someone is still opening fifty PDFs to build the list in the first place.
Key Takeaways
- Processing fifty Japanese purchase orders by hand costs your procurement team fourteen hours every year — and that is the cost you can see.
- The cost you cannot see: a flat list of rows can never tell you which three suppliers eat 45% of your budget or which delivery dates are about to collide on a single dock.
- Write out the twelve columns your dashboard actually needs once, drop all fifty POs in at once, and four dashboard dimensions — spend, delivery, tax, cash-out — stop being a separate analytics project and become the default output.
Why Fifty Individual PO Rows Don't Add Up to a Procurement Dashboard
The single-PO extraction workflow — covered in the step-by-step guide to extracting Japanese purchase order data — reduces the per-PO manual entry from minutes to seconds. Define twelve column names, upload a PO, get a structured row. For a procurement manager receiving fifty POs per month, that workflow makes each individual PO fast. It does not make the fifty-PO collection useful.
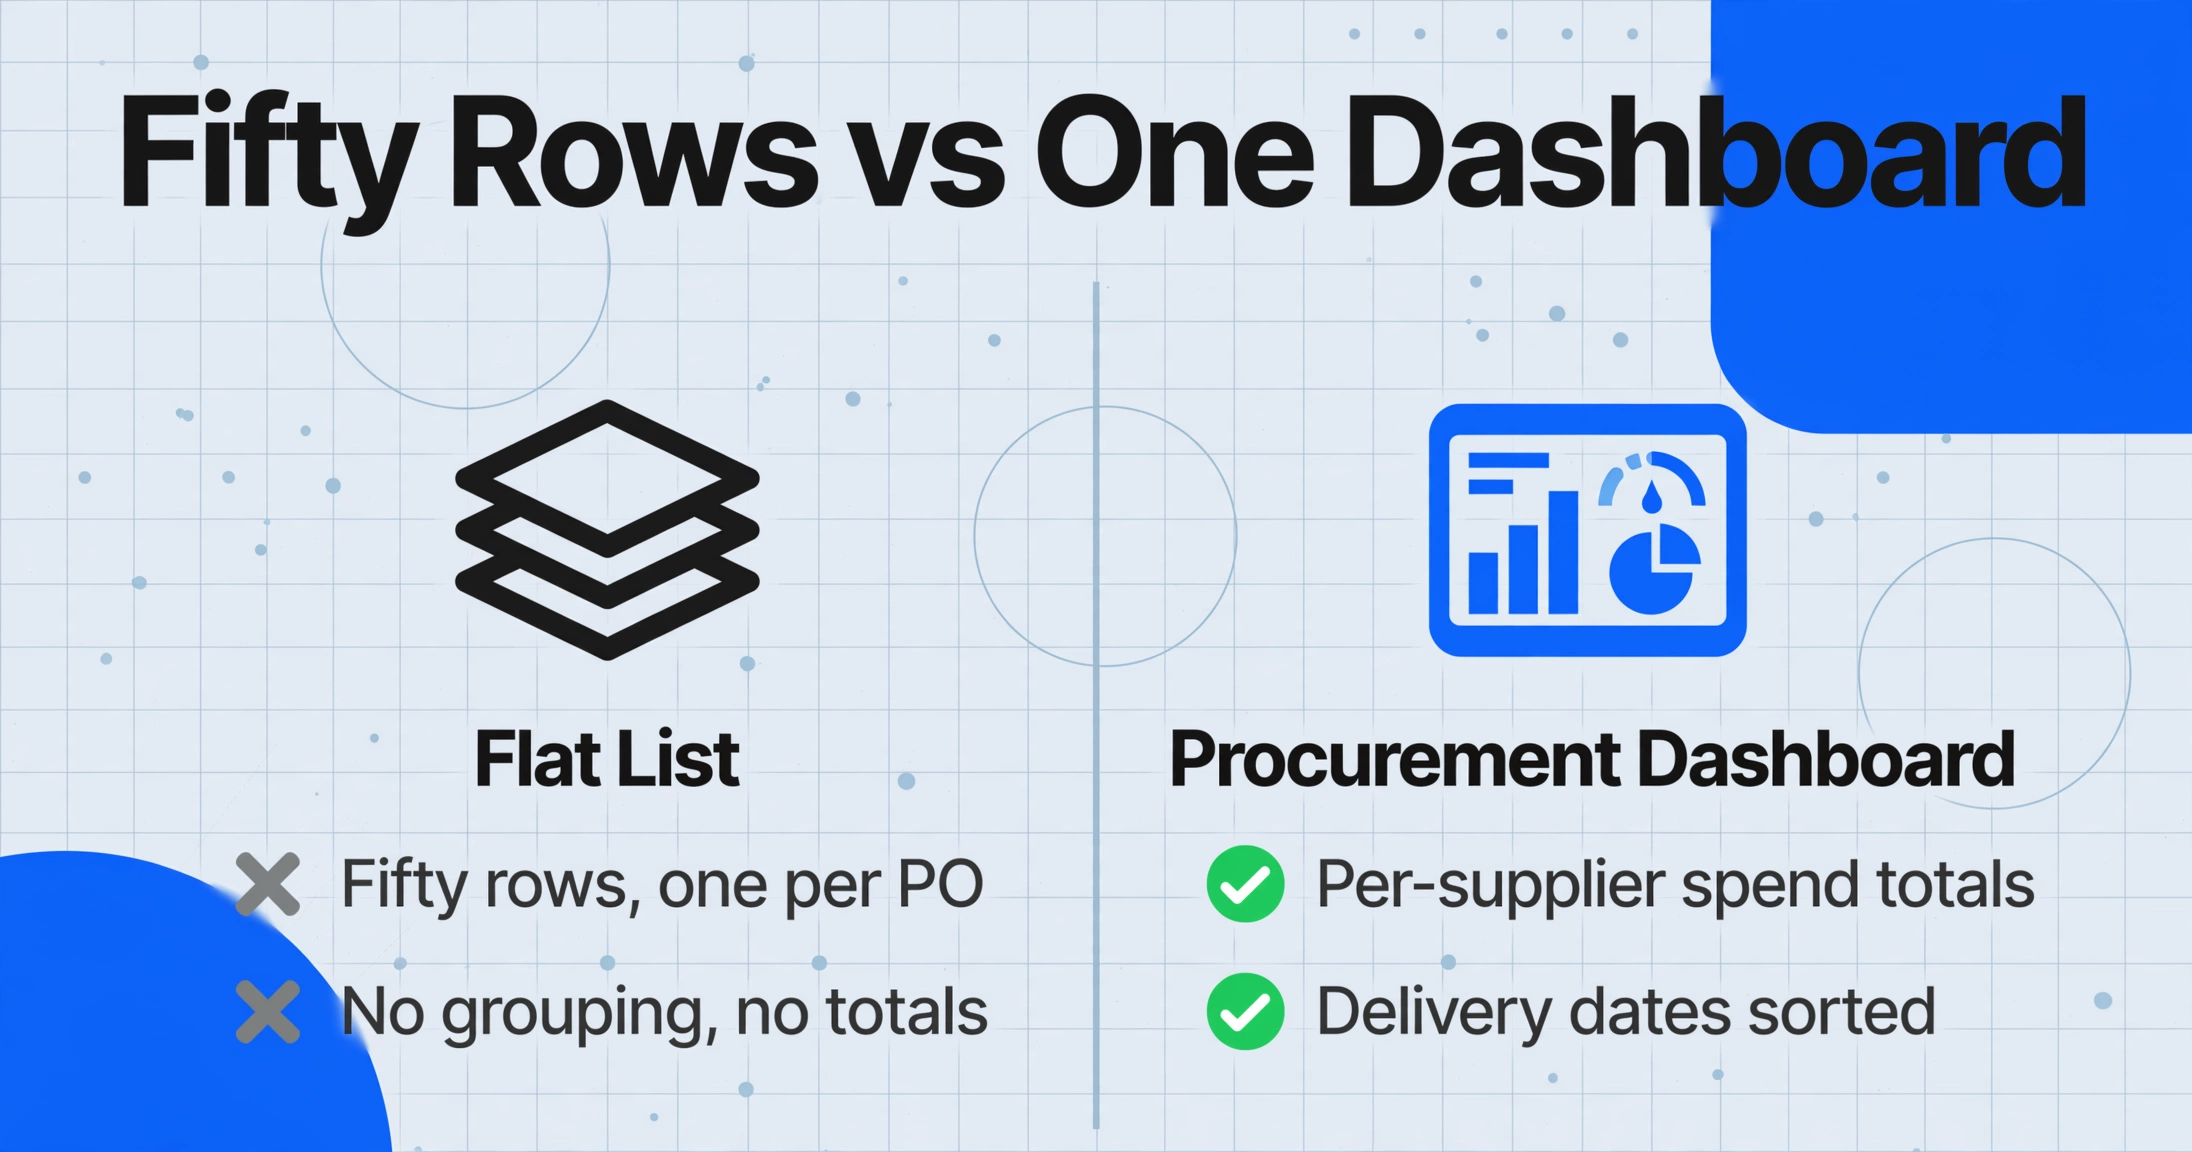
The structural difference between a list and a dashboard is that a dashboard groups data by dimensions that a single row cannot express: per-supplier aggregate spend, delivery commitments sorted by date, consumption tax totals by rate bracket, and payment obligations clustered by settlement day.
A single PO row tells you that Mitsubishi Chemical is delivering 2,000 units of gasket A at ¥480 each, totalling ¥960,000, tax-exclusive, for delivery on August 15 to the Saitama factory, with payment terms of 20日締翌月末払い (settlement on the 20th, payment by end of following month). What a single row cannot tell you: that across eight other POs from Mitsubishi Chemical this month, the total spend is ¥3.4 million — making them the second-largest supplier by procurement volume. That four POs from four different suppliers all have delivery dates within the next seven days and the logistics team needs a consolidated pick list. That ¥8.2 million in PO line items are taxed at the 10% standard rate while ¥1.6 million in food-related line items carry the 8% reduced rate — and the procurement tax exposure across those two brackets will drive the next quarter's consumption tax return. That twelve suppliers close their billing on the 20th and their combined payment obligation is ¥5.1 million, while six suppliers close on the last day of the month and their combined obligation is ¥2.8 million — two cash-out dates with two distinct liquidity impacts.
These four answers live in the same fifty PO documents. They are invisible when those fifty POs are processed one at a time into flat rows — not because the data is missing, but because the relationships between rows are the only thing that turns a list into a dashboard, and a human processing one PO at a time cannot see relationships until the fifty rows are assembled. By the time the last PO is entered, the first PO's supplier relationship to the next eight from the same vendor is a memory, not a column.
Files are processed securely and not stored.
The Extraction Schema: Twelve Columns That Power Four Dashboard Dimensions
The extraction schema for a Japanese PO batch is not the same as the single-PO extraction schema — not because the documents differ, but because the output destination differs. A single-PO extraction produces a row you read. A batch extraction produces a table a pivot formula reads. The column set needs to include classification fields that the single-PO workflow can leave implicit but the dashboard must treat as explicit dimensions.
For Custom Column Extraction — where you type the column names you want and the AI locates the matching data on each document by understanding what each field means rather than where it sits — the batch schema for a Japanese PO dashboard extends the single-PO column set with two additional classification columns:
| Column Name | Type | Dashboard Role |
|---|---|---|
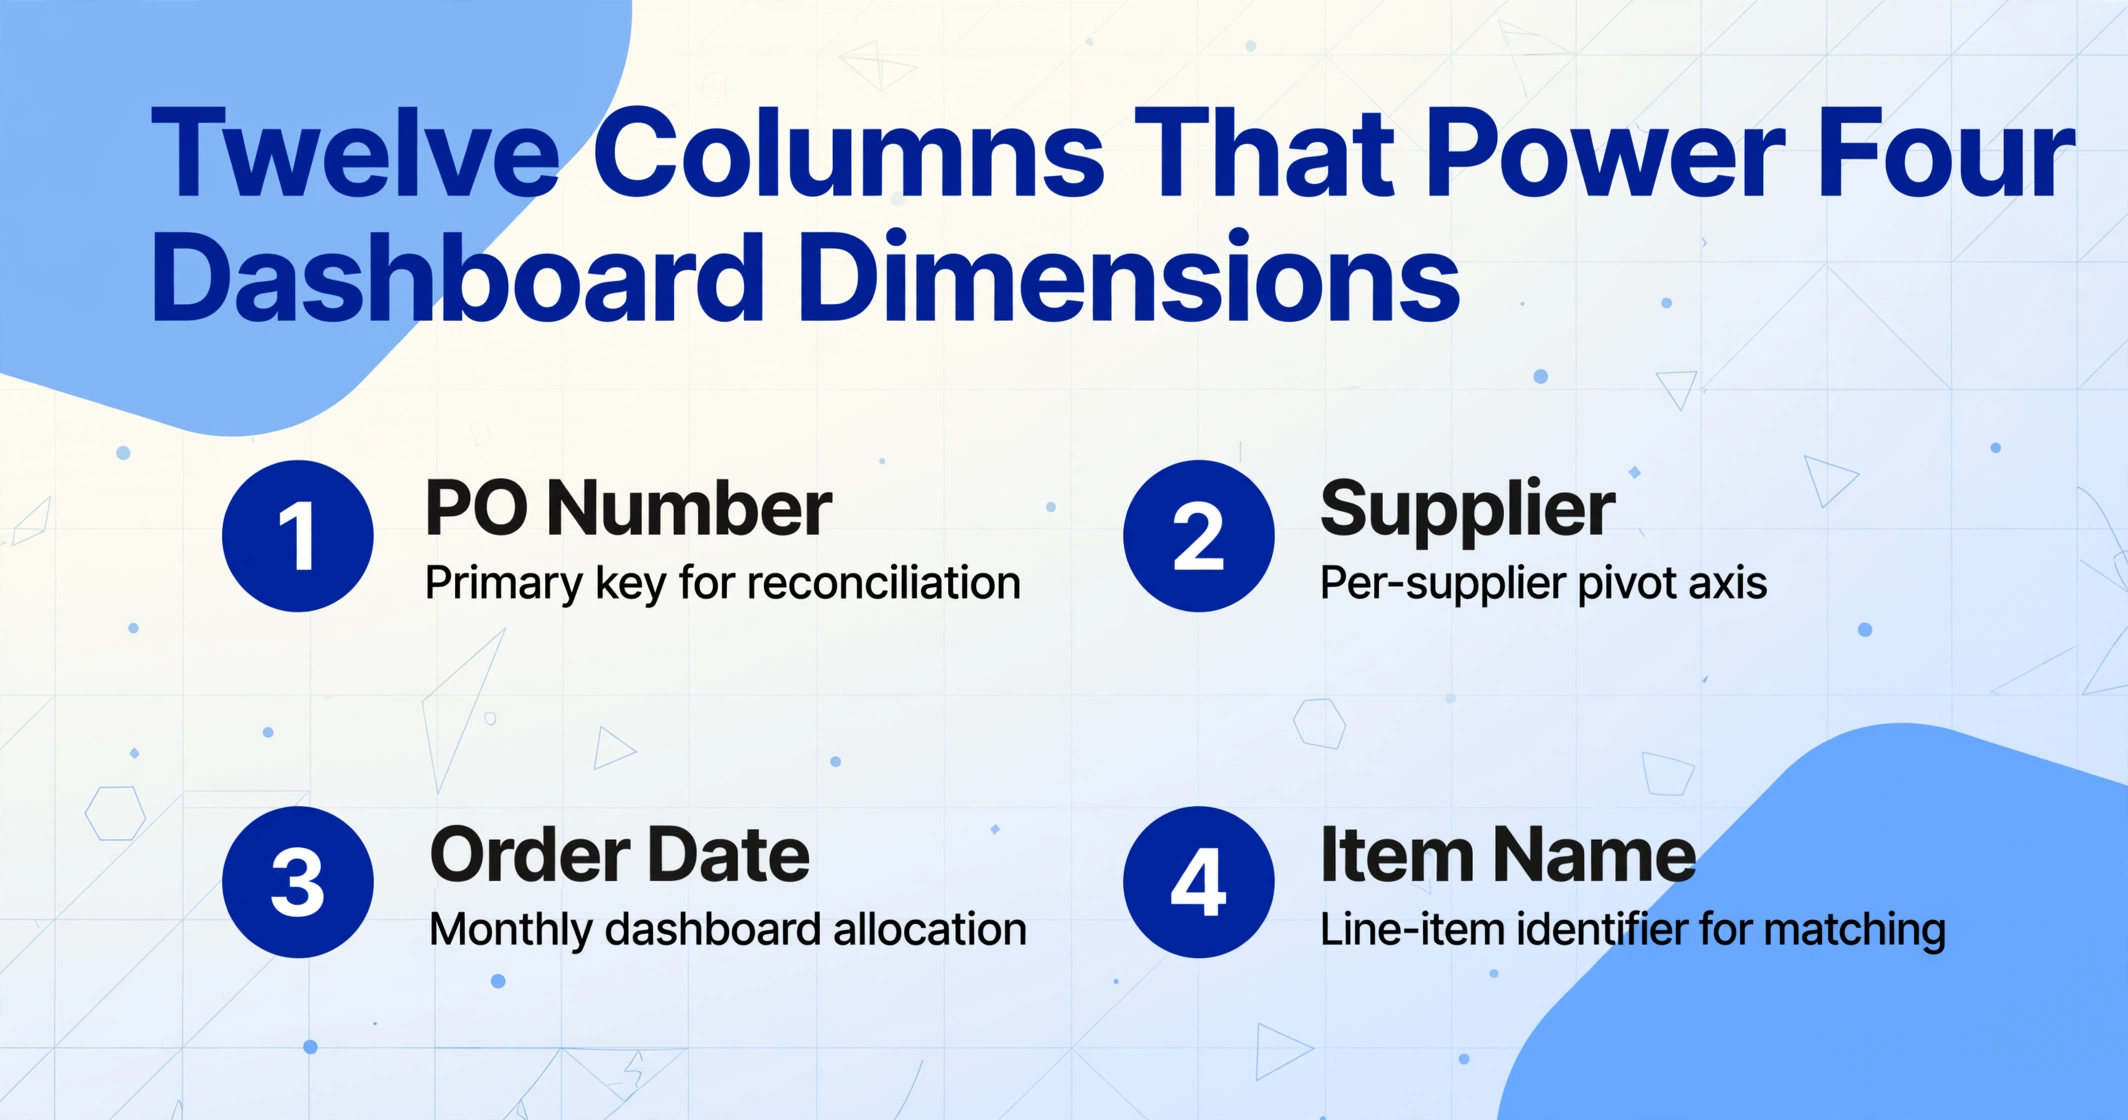
| PO Number (発注番号) | Identity | Primary key — links the PO row to its matching delivery note and invoice in the three-way reconciliation workflow |
| Supplier (発注先) | Grouping Dimension | The per-supplier pivot axis. Must be extracted consistently — "㈱日立製作所" on one PO and "日立" on another breaks the pivot table. Use the full supplier name as printed on the PO header |
| Order Date (発注日) | Period Allocation | Determines which monthly dashboard the PO belongs to. An order dated September 30 belongs to the September batch regardless of when the delivery arrives |
| Item Name (品名) | Detail | Line-item identifier. Supplier-specific abbreviations are common — SUS304 vs ステンレス, 一式 vs batch — and must be extracted as written for invoice matching |
| Quantity (数量) | Detail | Numerical quantity. Extract the unit separately: 個 (pieces), 式 (lot), kg, m, 時間 (hours). Unit mismatches between PO and invoice are a reconciliation pain point — the PO says 1式, the invoice itemizes it as 5個 |
| Unit Price (単価) | Detail | Typically tax-exclusive (税抜). The invoice may show tax-inclusive unit prices — comparing a 税抜 PO price against a 税込 invoice price produces false mismatches |
| Line Amount (金額) | Detail | Quantity × Unit Price. Used for line-level reconciliation against delivery notes and invoices |
| Delivery Date (納期) | Timeline Dimension | The date goods must arrive. Sort by this column to produce the weekly delivery pick list for the logistics team. POs with dates within the next seven days are the actionable subset |
| Delivery Location (納入場所) | Routing | The specific delivery point — often a factory name, building, and assembly line. Example: "株式会社〇〇 埼玉工場 第二組立課 B棟3階." Granularity matters for logistics routing and must be extracted in full without truncation |
| Payment Terms (支払条件) | Cash-Flow Dimension | The settlement schedule expressed as a compound string: "20日締翌月末払い" means billing closes on the 20th, payment due by end of following month. "月末締翌々月末払い" means end-of-month close, payment by end of month after next. A computed column can extract the settlement day (締日) as a number — 20, 31, or the specific day — creating the grouping key for the cash-flow dashboard |
| Consumption Tax Classification (消費税区分) | Tax Dimension | An Inferred Column — the AI classifies each line item during extraction: 10% Standard (standard goods and services), 8% Reduced (food, non-alcoholic beverages, subscription newspapers), or Tax-Exempt (非課税 — exports, certain medical and educational services). The column is not a field printed on the PO; it is a classification the AI derives from the item description during extraction. Group by this column to break out procurement tax exposure by rate bracket |
| Total Amount (合計金額) | Aggregation | The PO-level total, typically tax-exclusive. Sum per supplier to produce per-supplier spend. Sum per settlement day to produce per-shimebi cash-out figures |
The two classification columns — Payment Terms and Consumption Tax Classification — are what turn a flat list into a dashboard. Without them, per-supplier spend is the only dimension you can compute by sorting and summing. With them, four dimensions open up: who you're buying from, when it arrives, how it's taxed, and when you pay for it.
The JFTC's mandatory field requirements under the Subcontract Act (下請代金支払遅延等防止法) ensure that every compliant Japanese PO carries the same core data. The format varies by supplier — Mitsubishi Chemical's PO layout has nothing in common with a local subcontractor's handwritten fax — but the field content follows the same structure. The extraction AI reads by field meaning, not position: PO Number (発注番号) is the unique identifier on every PO regardless of whether it is printed top-right on branded stationery or penciled in the margin of a fax form. The same semantic logic locates every column across every supplier's format. The schema is defined once and applied across fifty POs — and next month, and the month after that.
Processing the Monthly Batch: Fifty POs, One Upload, One Structured Spreadsheet
With the schema defined, the monthly batch processing step shifts from data entry to data organization. The batch workflow differs from the single-PO workflow in three ways that matter at fifty-PO scale: file naming is the provenance layer, parallel processing collapses the per-document wait, and verification targets the outliers rather than every row.
Organize supplier POs by month — the folder structure is the audit trail
Create a folder per month: /Procurement/POs/2026_08/. Every supplier PO that arrives during August — email PDFs from trading companies (商社), fax printouts from small manufacturers, scanned paper forms from local subcontractors — goes into this folder. The file name should preserve the supplier identity: MitsubishiChemical_PO-2026-089.pdf rather than scan001.pdf. When the extraction output includes a Source File Name column, each row in the dashboard traces back to a specific PDF — and a folder of fifty PDFs with supplier-keyed filenames makes the dashboard audit-ready without opening a single source document.
Upload all fifty POs in one batch — the schema processes every document identically
Drop all files from the month's folder into the upload queue. Batch processing handles the fifty documents as one job: each PO is processed independently with the same column schema, all results merge into one spreadsheet. The AI reads each document by semantic meaning — a PO number is a PO number whether it appears as 発注番号: PO-2026-089 on a formatted PDF header or as PO No. 089 scrawled on a handwritten fax. The twelve-column schema works across all fifty POs because the field definitions describe what the data is, not where it sits on a specific supplier's form. Processing runs in parallel: fifty POs complete in roughly the same time as one.
Verify the outliers — not every row
The output is a spreadsheet of fifty rows with twelve columns. Manual verification at fifty-PO scale shifts from row-by-row checking to outlier detection. Sort by Total Amount descending and spot-check the top five POs — the largest procurement commitments, which typically account for 60% of monthly spend, are the rows where an extraction error has the highest financial impact. Sort by Consumption Tax Classification and verify that food-item line items are classified as 8% Reduced and standard-goods lines as 10% Standard. Scan the Supplier column for naming inconsistencies — if "㈱日立製作所" and "日立" appear as separate suppliers, they are the same vendor and the pivot table will double-count. Correct the supplier names in the spreadsheet before the dashboard step — or better, add a column rule during schema definition that normalizes supplier names using the full registered name.
The output is a single spreadsheet where each row is a PO line item and each column maps to one of the twelve schema fields. The spreadsheet structure — same columns, same order, same field definitions — is identical every month because the schema is reused, not rebuilt. A dashboard built on January's schema works on February's output without reformatting. The consistency is structural, not habitual.
Reading the Dashboard: Four Procurement Dimensions One Spreadsheet Reveals
With fifty PO line items structured in twelve columns, the dashboard is a set of pivot tables and sorted views — each answering one of the four questions the procurement manager needs every month. The dashboard is not a separate document. It is the same spreadsheet viewed through four different lenses, each using a subset of the twelve columns.
Per-Supplier PO Totals — who is getting what share of procurement spend
The first dimension groups rows by the Supplier column and sums the Total Amount. A pivot table on those two columns produces a ranked vendor spend list: Supplier A: ¥5.2M, Supplier B: ¥3.4M, Supplier C: ¥2.8M, and so on through all thirty-plus vendors. This is the dimension that the flat list of fifty rows obscures because the same supplier's POs — Mitsubishi Chemical has nine this month, a small subcontractor has one — are interleaved chronologically by order date. Grouping by supplier reveals concentration: three suppliers account for 45% of monthly procurement spend. That concentration is invisible when you process POs one at a time and enter each row sequentially.
The per-supplier view also surfaces a pattern that manual entry routinely misses: the same item ordered from two different suppliers at two different unit prices. If Supplier A quotes ¥480 per unit for gasket A and Supplier B quotes ¥510 for the same item on a different PO, the per-supplier pivot — filtered by Item Name — makes the price difference a single row comparison. In a flat list, the two rows are separated by thirty other entries and the delta requires a human to notice. In the dashboard, a filter on "gasket A" across all suppliers is one click.
Delivery Timeline — which POs are due this week
The second dimension sorts the fifty rows by Delivery Date ascending and filters for the current week or the next seven days. The columns that matter for logistics: Supplier, Item Name, Quantity, Delivery Location. The output is a pick list for the receiving team — "this week, we are receiving 2,000 gaskets from Mitsubishi Chemical at the Saitama factory Assembly Line 3, 500 liters of cutting fluid from Sumitomo at the Yokohama plant, and twelve boxes of packaging material from a local supplier at the main warehouse." Each line has a delivery location that maps to a specific receiving dock.
This view also surfaces delivery date clusters: seven POs from five different suppliers all have delivery dates of August 28. The logistics team now knows August 28 is a high-volume receiving day and can allocate dock space and inspection staff accordingly — a planning decision that is not possible when delivery dates are scattered across fifty individual PDFs and never assembled into a single timeline.
Consumption Tax Breakdown — procurement tax exposure by rate bracket
The third dimension groups rows by the Consumption Tax Classification column — the Inferred Column where the AI classified each line item as 10% Standard, 8% Reduced, or Tax-Exempt during extraction. A pivot on this column against Line Amount sums the taxable base at each rate:
| Tax Classification | Taxable Base (Tax-Exclusive) | Consumption Tax | Share of Monthly Procurement |
|---|---|---|---|
| 10% Standard | ¥8,200,000 | ¥820,000 | 72% |
| 8% Reduced | ¥1,600,000 | ¥128,000 | 14% |
| Tax-Exempt (非課税) | ¥1,500,000 | ¥0 | 13% |
| Total | ¥11,300,000 | ¥948,000 | 100% |
This breakdown matters for two reasons. First, it feeds directly into the consumption tax return (消費税申告) — the procurement-side input tax credit (仕入税額控除) requires the taxable purchase amount split by the 10% and 8% rate categories to comply with the Qualified Invoice System (インボイス制度) that took effect in October 2023. The invoice matching step — verifying that each supplier's invoice tax breakdown matches the PO tax classification — uses this dashboard view as the reference table. If a supplier's invoice claims 10% consumption tax on a food-item line that the PO classified as 8% Reduced, the discrepancy is visible before payment approval.
Second, it is a budgeting input. If 72% of monthly procurement spend is at the 10% rate, the consumption tax component of the procurement budget is approximately ¥820,000 per month — a cash-flow line that the finance team can forecast forward instead of discovering at month-end when the supplier invoices arrive with tax totals that do not match the internal estimate.
Payment Terms by Settlement Day — cash-out obligations grouped by 締日
The fourth dimension groups PO totals by the settlement day (締日, shimebi) extracted from the Payment Terms column. Japanese POs express payment terms as a compound convention rather than a simple "Net 30" date calculation. The common patterns:
| Payment Terms on PO | Settlement Day (締日) | Payment Window (months after settlement) | Practical Meaning |
|---|---|---|---|
| 20日締翌月末払い | 20th | ~1 | Transactions from the 21st of last month through the 20th of this month are settled together. Payment due by end of following month |
| 月末締翌月末払い | Last day of month | 1 | Full calendar month transactions settled together. Payment due by end of following month |
| 月末締翌々月末払い | Last day of month | 2 | Full calendar month transactions. Payment due by end of month after next — common in manufacturing, effectively 60-day terms |
| 10日締翌月末払い | 10th | ~1.5 | Transactions from the 11th of last month through the 10th of this month. Less common but used by some large corporate buyers |
A Computed Column — a column whose value the AI calculates during extraction rather than reading directly from the document — parses the payment terms string into two structured values: Settlement Day (the day number — 20, 31, 10) and Payment Lag (the number of months between settlement and payment — 1 for 翌月末, 2 for 翌々月末). The dashboard then groups PO totals by Settlement Day:
| Settlement Day (締日) | Number of Suppliers | Combined PO Total (Tax-Exclusive) | Estimated Payment Date |
|---|---|---|---|
| 20日締 | 18 | ¥6,300,000 | End of following month |
| 月末締 (翌月払い) | 8 | ¥3,100,000 | End of following month |
| 月末締 (翌々月払い) | 4 | ¥1,900,000 | End of month after next |
The settlement-day grouping is the cash-flow dimension of the procurement dashboard. Eighteen suppliers closing on the 20th represent ¥6.3 million in payment obligations due approximately 40 days after the 20th of the month. Four suppliers on 翌々月払い terms defer ¥1.9 million by an additional month. The finance team now knows the cash-out profile by date cluster, not by individual PO — and can plan working capital around two payment waves instead of fifty individual due dates.
From Monthly Dashboard to Fiscal-Year Procurement Analytics
The monthly batch workflow compounds in value the longer it runs. January's dashboard answers four procurement questions for January. Twelve monthly dashboards, stacked into one fiscal-year procurement ledger, answer a different set of questions: which supplier grew their share of procurement spend from Q1 to Q3, how seasonal delivery patterns affect logistics staffing, whether the consumption tax rate mix shifted with supplier mix, and which suppliers consistently use longer payment terms — a negotiation lever during annual contract renewal.
The dashboard structure makes the annual consolidation a structural operation rather than a reconstruction exercise. Each month's spreadsheet has the same twelve columns in the same order. Stacking January through December into one annual ledger is a copy-paste operation — the columns align because the schema never changed. Add a Month column to preserve provenance, and the annual ledger now supports quarter-over-quarter views: filter by Q1 (April–June for most Japanese companies on a March fiscal year-end, 3月決算), pivot by supplier, and compare against Q2 supplier spend. A supplier whose share grew by 30% from Q1 to Q3 is a procurement trend that a flat list across twelve individual months never reveals.
The same twelve-column schema that processed the August 2026 POs also processes the August 2025 POs — archived documents that the corporate tax law (法人税法) requires companies to retain for seven years. Retroactive batch processing of a prior fiscal year's POs turns an archive of PDF files into a structured procurement ledger that an auditor can navigate by supplier, month, and tax classification — without opening the source documents. The time saved is not in the extraction step, which processes a prior year's fifty POs as quickly as this month's. It is in the audit response: when the tax office (税務署) requests all purchase orders above ¥1 million from Fiscal Year 2025, the dashboard filtered by Total Amount descending gives them a sorted list with document traceability in under a minute.
This multi-period batch consolidation pattern transfers across tax jurisdictions with the same underlying logic: one extraction schema applied across multiple reporting periods produces one unified ledger. The quarterly batch approach used by Australian bookkeepers to merge four quarterly BAS returns into one annual tax ledger and Canadian accountants consolidating GST/HST returns into one annual tax summary follows the identical structure: define the columns once, run the same schema every period, let the merge emerge from the structure. The tax fields change per jurisdiction; the batch principle does not.
FAQ
Does the batch workflow work if every supplier uses a different PO format?
Yes — that is the defining advantage of semantic extraction over template-based OCR. A template-based tool requires a separate parsing template per supplier format, and when a supplier redesigns their stationery or upgrades their ERP, the template breaks. Semantic extraction reads each PO by understanding what the data means — a PO number (発注番号) is the identifier regardless of whether it appears in a formatted table block on a Mitsubishi Chemical PDF or handwritten on a subcontractor's fax form. The twelve-column schema works across all fifty POs in the batch because the AI is searching for field meaning, not field position. Next month, when a supplier changes their PO layout, the same schema still works — nothing to update.
How does the dashboard handle a single PO with line items at both 10% and 8% consumption tax rates?
The Consumption Tax Classification column is applied at the line-item level, not the PO level. A single PO with three line items — two standard goods at 10% and one food item at 8% — produces three rows in the dashboard, each with its own tax classification. The dashboard's tax-breakdown pivot correctly assigns ¥9,600 of standard-rated spend to the 10% bracket and ¥3,200 of reduced-rated spend to the 8% bracket, even though both rows share the same PO Number. The PO-level total is still computed (sum of all line items for that PO Number), but the tax classification is a per-line attribute — which is how the consumption tax return requires it to be reported under the Qualified Invoice System (インボイス制度).
How does the computed column extract the settlement day from payment terms like "20日締翌月末払い"?
The Payment Terms field on a Japanese PO is a compound expression that encodes two values in one text string. A Computed Column — a column where the AI performs a calculation during extraction — parses the string into structured values. The column name instructs the AI what to extract: Settlement Day (shimebi day number — from Payment Terms; if "20日締" then 20, if "月末締" then 31, if "10日締" then 10). A second computed column extracts the payment lag: Payment Lag Months (from Payment Terms; if "翌月末払い" then 1, if "翌々月末払い" then 2). The AI reads the Japanese payment terms convention, extracts the two numeric values, and the dashboard groups rows by Settlement Day using the extracted number as the grouping key. The original Payment Terms text string remains in its own column for audit reference.
What if a single PO spans multiple pages — does the batch merge them correctly?
Yes. Upload all pages of the PO in the same batch. When a multi-page PDF is uploaded, the extraction engine treats all pages as a single document: header fields (PO number, supplier, order date, payment terms, delivery location) are extracted once from the first page, and line items from all pages — including continuation pages with no header, just a table of items continuing from the previous page — are collected into the same row set, all linked to the same PO Number. A four-page PO with twelve line items across pages two through four produces twelve dashboard rows, each carrying the same PO Number, Supplier, and Order Date. The line-item detail varies, the header data is consistent.
Can I reuse the same column schema every month, or does it need adjustment per batch?
Reuse it unchanged. The twelve-column schema defined for the August 2026 batch processes the September 2026 batch without modification — and the August 2027 batch a year later. A supplier may change their PO format, a new supplier may be onboarded with a format you have never seen, and the schema handles both because it describes what data to extract, not where on a specific format to look. If a new reporting requirement emerges — the procurement department starts tracking a Cost Center (原価部門) field — add a thirteenth column to the schema. Retroactively add it to prior months' spreadsheets with blank cells, and from the current month forward, it populates. The schema is a living document, not a one-time setup. The key discipline: if you add a column, add it to the historical spreadsheets first, before running the new month's batch — so the annual stack still aligns.
Can the dashboard export directly to Japanese accounting software?
The dashboard is an Excel spreadsheet (XLSX). Every major Japanese accounting and procurement platform accepts structured spreadsheet imports. Yayoi (弥生会計 / 弥生販売) imports CSV data into its purchase ledger module, with the column headers mapping directly to Yayoi's field names: PO Number → 伝票番号, Supplier → 仕入先, Amount → 金額. freee supports CSV import with automatic journal entry generation (自動仕訳), and the consumption tax classification column feeds directly into freee's dual-rate consumption tax reporting. MoneyForward Cloud Accounting (マネーフォワード クラウド会計) accepts batch CSV imports into its purchase management module. Kanjo Bugyo (勘定奉行), used by mid-size Japanese companies, supports multi-department cost allocation (部門別原価管理) from imported PO data. The bottleneck has never been the import capability — it has been getting fifty POs into structured spreadsheet form in a single operation. Once you have the dashboard spreadsheet, the import into any of these platforms is a file upload.
Can the same batch-dashboard approach handle other Japanese procurement documents?
The schema changes per document type; the batch-to-dashboard principle transfers directly. For delivery notes (納品書): define columns for PO Number (the join key), Delivered Quantity, Delivery Date, and Receiving Signature. Batch-process all delivery notes for the month, group by PO Number, and compare delivered quantities against ordered quantities — a receiving discrepancy report generated from the same batch workflow. For invoices (請求書): define columns for Invoice Number, PO Number, Billed Amount, Consumption Tax, and Furikomi Bank Details (振込先). Batch-process all invoices, group by settlement day, and produce a payment schedule — the cash-out side of the procurement dashboard. The single-PO extraction guide covers the field-level detail for each document type in the Japanese procurement chain. The batch dashboard described here is the aggregation layer on top — same extraction mechanism, different output view.
From a Spreadsheet of Rows to a Procurement Decision Tool
The procurement department that processes fifty POs per month by opening each PDF and retyping the same twelve fields into a spreadsheet is building a list. The list is accurate. It cannot answer the four questions that justify the procurement manager's role: which suppliers are getting what share of spend, what deliveries are arriving this week, what is the tax exposure by rate bracket, and what is the cash-out profile by settlement day. Those four answers require the same data viewed through four different grouping dimensions — and building those dimensions requires the data to be structured in columns that a pivot table can consume, in a single spreadsheet, with consistent column definitions applied across every PO in the batch.
A batch extraction workflow that defines those twelve columns once and applies them to fifty POs simultaneously produces the structured spreadsheet in the time it currently takes to manually enter one PO. The dashboard — the per-supplier pivot, the delivery timeline sort, the tax-breakdown group, the settlement-day cluster — is no longer a separate analytics project that someone builds in Excel after the data entry is done. It is the natural output of an extraction step that was designed to produce dashboard-ready columns, not flat rows.
The procurement team gets back the seventy-plus minutes per month they currently spend retyping PO data — seventy minutes that compound to fourteen hours per year. More importantly, they get a dashboard that answers the four questions every month, from the first month the schema is defined, without any additional data manipulation. The list becomes a dashboard not because someone spent an afternoon building pivot tables, but because the extraction step made the dashboard the default view.