50 Zollanmeldungen, One Tariff Summary:
What German Importers Learn When They Batch Customs Declarations
An importer receiving 50 containers a month from six countries files 50 electronic customs declarations (Zollanmeldung) through ATLAS, each with its own 11-digit tariff code (Zolltarifnummer), customs value (Zollwert), and procedure code (Zollverfahrenscode). Individually, each declaration is a one-time compliance event — a box checked for the Zollamt. Collectively, those 50 declarations contain a tariff intelligence asset that most importers never extract: which HS-code categories are driving import volume, which countries of origin account for the largest customs-value exposure, and what proportion of goods enters under each customs procedure — free circulation, transit, or bonded warehouse (Zolllager). The difference between seeing 50 declarations as 50 compliance tasks and seeing them as one cross-period tariff dataset is the difference between reacting to duty bills and planning for them.
Key Takeaways
- You file 50 Zollanmeldungen each month and treat each as a one-time compliance event — when collectively, those same 50 declarations contain a tariff intelligence dataset that reveals which three HS headings drive 60% of your import duty bill.
- Your quarterly duty forecast starts from a single aggregate number — total duty paid last quarter — with no visibility into which products, countries of origin, or customs procedures produced it, because ATLAS processes declarations individually and never aggregates across them.
- Define one extraction schema with eleven fields, apply it to every Zollanmeldung each month, and your duty forecast shifts from "last quarter was expensive" to "heading 8471.30, imported from Vietnam under procedure 4000, accounts for 40% of it — here is the FTA optimization."
The Monthly Stack Problem: 50 Declarations, Zero Cross-View
One Zollanmeldung tells you how much duty you owe on one shipment. Fifty Zollanmeldungen, spread across a month and six countries of origin, tell you where your tariff exposure actually lives — but only if you have a way to look across them.
A mid-sized German importer bringing in consumer electronics from China, industrial components from Japan, textiles from Vietnam, machinery from the United States, food ingredients from Thailand, and chemical intermediates from Switzerland files roughly 50 Zollanmeldung per month. Each declaration is submitted through ATLAS (Automated Tariff and Local Customs Clearance System), the electronic customs platform operated by the German customs administration (Zollverwaltung) under the EU Union Customs Code (Regulation EU No 952/2013). Each declaration clears one shipment. Each shipment carries a specific tariff classification, a customs value assessed on a CIF basis, and a procedure code indicating whether the goods enter free circulation, transit through Germany to another EU state, or deposit into a bonded warehouse (Zolllager) for deferred duty payment.
The problem is structural, not procedural. The ATLAS system processes each declaration as an independent electronic message. It validates the 11-digit tariff code, calculates the duty and import VAT (Einfuhrumsatzsteuer, 19% standard / 7% reduced), issues a tax assessment notice (Steuerbescheid), and closes the case. What ATLAS does not do — and was never designed to do — is aggregate across declarations. One declaration, one assessment. Fifty declarations, fifty assessments. The importer receives the individual Steuerbescheid for each shipment and files them. The cross-declaration view — which tariff codes are accumulating the most duty, which countries of origin are generating the highest aggregate customs value, what share of goods sits in bonded storage versus free circulation — remains invisible because the data lives in 50 separate PDFs, ATLAS confirmation screens, or broker spreadsheets that were never merged.
For a detailed walkthrough of extracting individual Zollanmeldung fields to Excel — the prerequisite step before batch consolidation — see our guide to extracting German customs declaration data to Excel. The focus here is on what happens after you can extract: building the cross-declaration tariff summary that turns monthly compliance into quarterly planning intelligence.
Three Summary Dimensions That One Declaration Cannot Answer
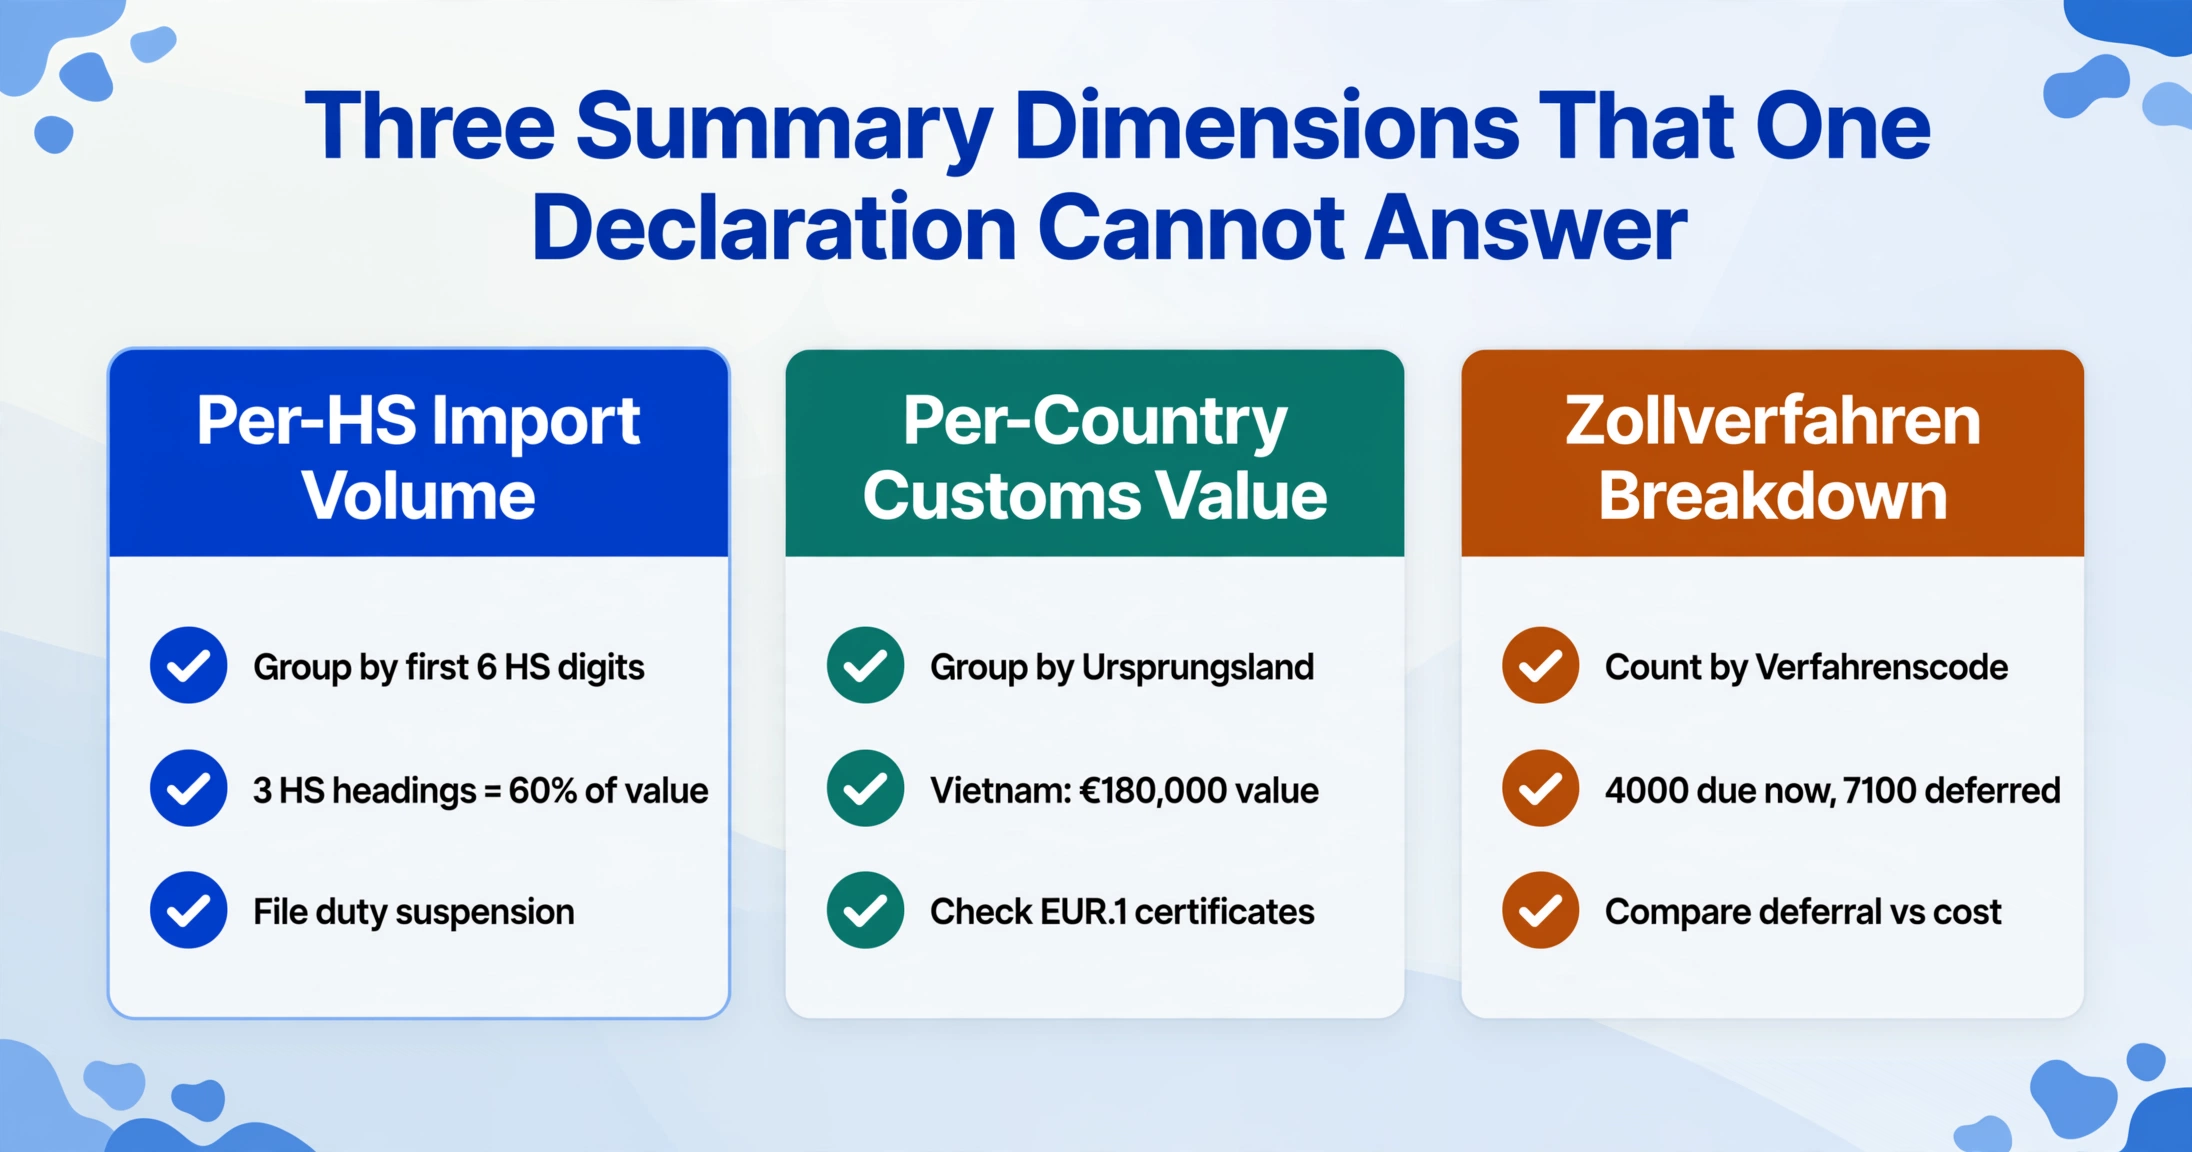
A single Zollanmeldung answers one question: how much duty does this shipment owe? A batch of 50 declarations, summarized across three dimensions, answers the questions that determine your next duty planning cycle:
Dimension 1: Per-HS-Code Import Volume
Each Zollanmeldung carries an 11-digit tariff code (Zolltarifnummer), structured as six HS digits (Harmonised System, administered by the World Customs Organization) plus two Combined Nomenclature digits (EU-wide) plus two TARIC digits (anti-dumping duties, quotas, tariff suspensions) plus one national digit for German-specific measures. When 50 declarations are merged into one table, you can sort and sum by the first six digits to see import volume per HS heading — or by the full 11 digits to see which specific TARIC-level codes are attracting trade defence measures.
An importer processing 50 declarations per month across six supplier countries discovers that 60% of the aggregate customs value falls under just three 6-digit HS headings — a concentration that makes duty-suspension applications for those headings a high-ROI exercise.
What this dimension answers: which product categories drive your import duty bill? If 8471.30 (portable automatic data-processing machines) accounts for 40% of your customs value, a successful duty suspension application under the EU's autonomous tariff suspension scheme directly reduces your monthly duty outflow on that heading. Without the cross-declaration summary, you know each shipment paid duty — but you do not know which tariff headings, in aggregate, are worth the administrative effort of a suspension or quota application.
Dimension 2: Per-Country Customs Value
The country of origin (Ursprungsland) on a Zollanmeldung determines whether preferential tariff rates apply under EU free trade agreements — and, when aggregated, reveals which sourcing countries are driving the largest customs-value exposure. A shipment from Vietnam carrying a EUR.1 movement certificate under the EU-Vietnam FTA pays a reduced or zero duty. A shipment from the same supplier but lacking the certificate pays the full MFN (most-favoured-nation) rate. Across 50 declarations, the delta between what you paid and what you could have paid under proper origin documentation becomes visible as a spread on a summary table.
This dimension also feeds the customs value declaration threshold. Under the UCC, shipments with a customs value under €10,000 may be exempt from a formal customs value declaration at the discretion of German customs. Knowing the per-country and per-shipment customs-value distribution lets you identify which supplier routes trigger the declaration requirement and which fall under the threshold — a visibility that most importers lack because the data is scattered across monthly filing folders.
Dimension 3: Customs Procedure Breakdown (Zollverfahren)
The Zollverfahrenscode on each declaration determines both the duty treatment and the cash-flow impact. The three most common codes for German importers, as documented in the German customs IZA completion guide, are:
| Code | Procedure | Duty Timing | Common Use Case |
|---|---|---|---|
| 4000 | Release for free circulation | Due immediately upon clearance | Goods going directly to German customers or distribution centres |
| T1 | External Union transit procedure | Deferred until arrival at destination EU member state | Goods entering via Hamburg or Bremerhaven destined for Poland, Czech Republic, or other EU countries |
| 7100 | Customs warehousing (Zolllager) | Suspended until goods leave the warehouse | Inventory held in Germany pending sale to multiple EU buyers, seasonal goods, or goods awaiting re-export |
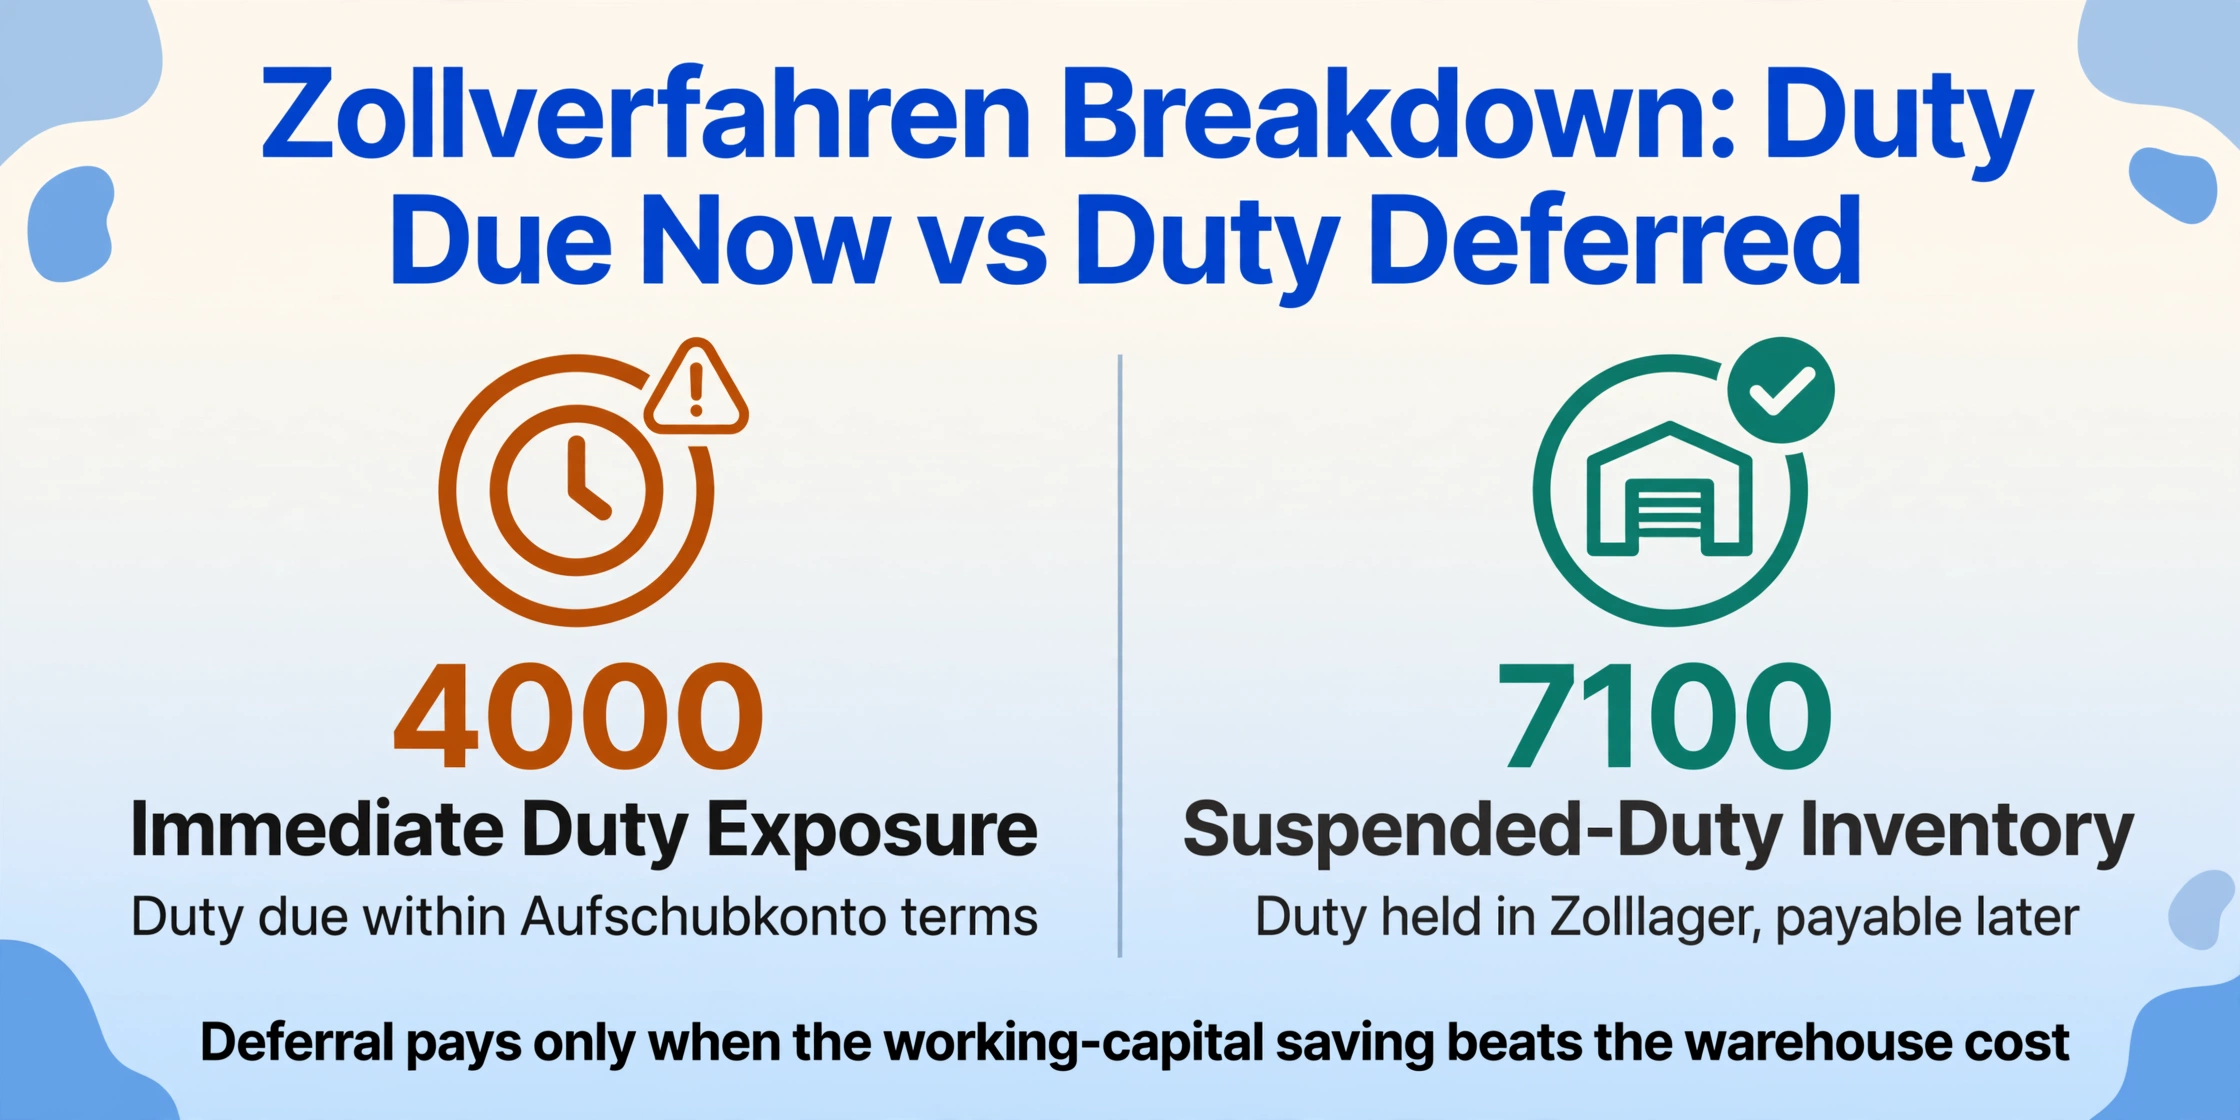
A monthly procedure-code breakdown tells a story about your cash flow. If 60% of your shipments clear under 4000 (free circulation), duty is due within the payment terms of your deferment account (Aufschubkonto). If 30% enter bonded warehouse (7100), that portion of duty is suspended — a working-capital advantage that disappears the moment the goods leave the warehouse. If 10% move under transit (T1) to another EU country, the duty liability shifts to the destination state. Knowing these proportions — and watching them shift month over month — is the difference between forecasting your quarterly duty cash outlay and being surprised by it.
The Fields on a German Zollanmeldung That Feed the Summary
Before defining an extraction schema, you need to know which fields on the Zollanmeldung carry the data your tariff summary depends on. The German electronic customs declaration, whether submitted through ATLAS directly or via a software provider like DAKOSY or AEB, carries the same core data set mandated by the UCC:
| Field | German Name | Format | Feeds Which Summary Dimension |
|---|---|---|---|
| Tariff Code | Zolltarifnummer / Warennummer | 11-digit numeric (e.g. 8471.30.00.00.9) | Per-HS import volume |
| Customs Value | Zollwert | EUR, decimal | Per-country customs value, per-HS duty calculation |
| Country of Origin | Ursprungsland | ISO 2-letter country code | Per-country customs value |
| Procedure Code | Verfahren / Zollverfahrenscode | 4-digit (e.g. 4000) | Procedure breakdown |
| Gross Mass | Rohmasse | kg, decimal | Volume context per HS heading |
| Net Mass | Eigenmasse | kg, decimal | Per-unit value analysis |
| Declaration Date | Annahmedatum | DD.MM.YYYY | Monthly/quarterly time-series grouping |
| EORI Number | EORI-Nummer | DE + 10-15 digits | Multi-entity importers: split by importer of record |
| MRN | Master Reference Number | 18-character alphanumeric (e.g. 24DE5866H1234A67R2) | Unique declaration identifier for audit trail |
Not every field appears in the same position on every declaration format. A Zollanmeldung generated in DAKOSY arranges these fields differently from one generated in AEB Import Filing or MIC-CUST. A paper-based Einheitspapier (Single Administrative Document, used as an emergency fallback when ATLAS is unavailable) puts the tariff code in Box 33 and the procedure code in Box 37 — a completely different layout from a digital ATLAS confirmation screen. This is where Custom Column Extraction — defining the information categories you want once as column names and letting the AI locate matching values by semantic meaning rather than field position — makes multi-format, multi-source batch processing possible. The commercial invoice document code that ATLAS requires (4/N380) may reference an invoice PDF that looks nothing like the customs declaration itself, and the AI needs to pull the same data points from all of them.
Define Once, Extract 50 Times: The Batch Extraction Schema
The extraction workflow for 50 monthly Zollanmeldung follows the same structural principle covered in detail in our guide to batch-processing Australian BAS into annual tax ledgers: define the column schema once, apply it to every document, and let the consistent output structure make cross-period summarization a pivot-table operation rather than a manual reconstruction.
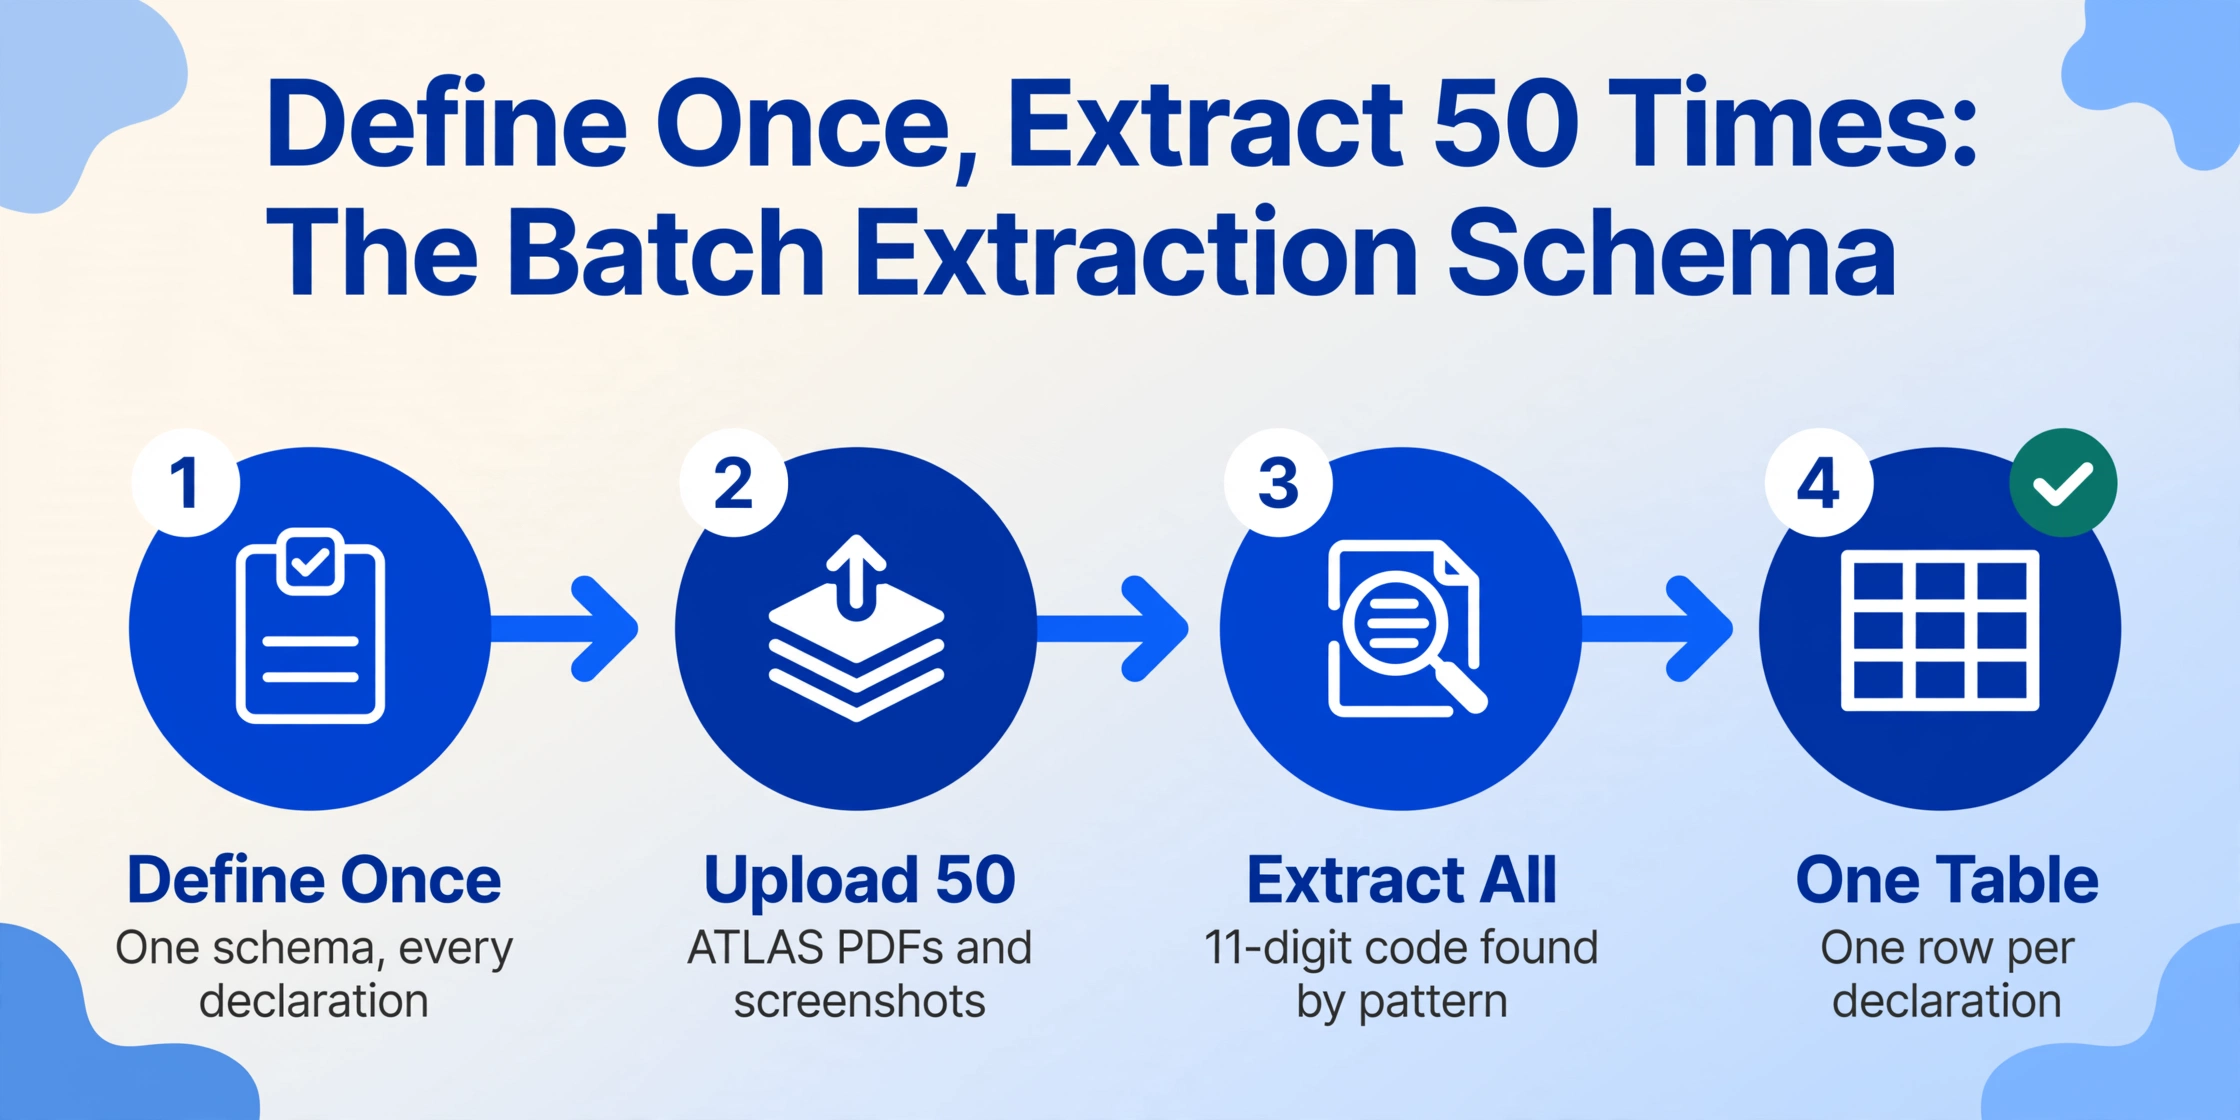
For a German importer who needs the three tariff-summary dimensions, the extraction schema is a focused subset of the full Zollanmeldung fields:
MRN  |  Declaration Date (DD.MM.YYYY)  |  Tariff Code (11-digit Zolltarifnummer)
Product Description  |  Country of Origin (ISO Code)  |  Customs Value (EUR)
Procedure Code (Zollverfahren)  |  Gross Mass (kg)  |  Net Mass (kg)
EORI Number  |  Supplier/Exporter Name
Define this list once. Upload the month's 50 declarations — ATLAS confirmation PDFs, DAKOSY screenshots, scanned Einheitspapier forms from emergency fallback filings, even commercial invoices referenced as document code 4/N380. The AI processes each document independently, locating the 11-digit tariff code by recognising the numeric pattern regardless of whether the surrounding label reads "Zolltarifnummer," "Warennummer," or "Codenummer." It extracts the customs value in euros. It identifies the procedure code. The output is one consolidated spreadsheet where each row is a declaration, each column is a field you defined, and the structure is identical for every declaration — regardless of source format or software.
Files are processed securely and not stored. Upload a sample Zollanmeldung and type your field names to test extraction.
The critical property here is structural consistency. When every declaration in the batch produces output in the same columns — MRN in column A, Tariff Code in column C, Customs Value in column E, Procedure Code in column G — the summarization step becomes a mechanical operation. Sort by the first six digits of the tariff code, sum the customs value column, and you have per-HS import volume. Sort by country of origin, sum customs value, and you have per-country exposure. Filter by procedure code, count and sum, and you have the Zollverfahren breakdown. The extraction step produces the rows; the spreadsheet produces the intelligence.
Building the Tariff Summary: From 50 Rows to Three Dashboards
With the consolidated extraction output in hand, building the three summary dimensions is a data operation rather than a research exercise. The extraction already mapped every field to a consistent column. The work shifts from "find the data on 50 different documents" to "group, sort, and sum what you already have."
These three summary views — per-HS, per-country, per-procedure — are built from the same underlying extraction. They do not require three separate data-entry exercises. They do not require pulling files from different ATLAS software archives. They require one extraction schema, applied to 50 declarations, producing one structured table, from which three pivot views answer the three questions that matter for duty planning.
One extraction run, one consolidated table, three summary views: The per-HS concentration analysis, the per-country origin FTA optimisation, and the Zollverfahren cash-flow profile are all derivatives of the same structured extraction output. The data was already there, fragmented across 50 PDFs. The batch extraction makes it visible in one place.
Why This Matters for Your Next Duty Planning Cycle
The quarter ends. The importer's finance team needs a duty forecast for the next quarter's cash-flow planning. Without the cross-declaration summary, the forecast is built from last quarter's aggregate duty paid — a single number pulled from the Aufschubkonto statement, with no visibility into what drove it. Was the duty bill high because import volume increased, or because a specific HS heading was hit with an anti-dumping duty mid-quarter? Was it high because a supplier in one country stopped providing EUR.1 certificates? Was it high because more goods cleared under 4000 instead of 7100, accelerating duty payment timing?
A single aggregate number cannot answer these questions. The three-dimensional tariff summary can:
| Question for Next Quarter's Planning | Which Summary View Answers It | Action It Triggers |
|---|---|---|
| Which tariff headings should we apply for duty suspension on? | Per-HS import volume | File autonomous tariff suspension application with German customs (Zollverwaltung) before the next EU submission window |
| Which supplier countries should we push for proper origin documentation? | Per-country customs value | Require EUR.1 or origin declaration on invoice for all shipments from FTA-partner countries exceeding a customs-value threshold |
| Should we shift more inventory into the bonded warehouse to manage duty cash flow? | Zollverfahren breakdown | Compare 4000 duty timing vs 7100 warehouse costs — if the duty deferral saves more in working capital than the warehouse costs, adjust the procedure split |
| Is our HS classification consistent across declarations from different software providers? | Per-HS import volume (drill-down to 11-digit) | Audit classification consistency — the same product from the same supplier should not appear under two different 11-digit codes across declarations filed through different ATLAS interfaces |
The quarterly duty planning cycle is only as good as the data it draws from. When that data is scattered across 50 individual Steuerbescheid PDFs and ATLAS confirmation screens, the planning cycle starts from a position of ignorance — you know the total duty paid, but not the structure behind it. When the data is aggregated into a structured tariff summary, the planning cycle starts from a position of visibility — you know which headings, which countries, and which procedures are driving the numbers, and you can act on each one specifically.
The same principle — define a schema once, batch-process multiple documents, and build a cross-period summary — applies across German customs documentation beyond the core Zollanmeldung. For importers who also handle delivery notes, the same extraction approach builds a consignment-level arrival log, detailed in our guide on batch-processing German delivery notes (Lieferschein). The extraction schema changes per document type; the batch principle — one definition, many documents, one consolidated output — transfers directly.
FAQ
Can the extraction handle Zollanmeldung from different ATLAS software providers in the same batch?
Yes. Whether your declarations were filed through DAKOSY GE, AEB Import Filing, MIC-CUST, LIS, or directly through the ATLAS internet declaration (IZA), the extraction is format-independent. The AI looks for the 11-digit tariff code pattern, the customs value in euros, the procedure code — regardless of which software generated the layout. A DAKOSY confirmation screen, an AEB filing summary, and a scan of an Einheitspapier emergency fallback form can all sit in the same upload queue and produce rows in the same output table.
What if the tariff code on some declarations is 10 digits and others are 11 digits?
The extraction captures whatever is printed on the declaration. The TARIC database provides 10-digit codes, while the German EZT-online (Elektronische Zolltarif-online) extends to 11 digits for national measures. Both are valid for import declarations — the 11th digit is a German national code. When summarising per-HS heading, group by the first six digits (the globally harmonised HS level) for cross-country comparability. When auditing classification consistency across your own declarations, compare at 10 or 11 digits to catch discrepancies in TARIC or national-level extensions.
Can I include commercial invoices (Handelsrechnungen) in the same batch alongside the Zollanmeldung?
Yes. ATLAS requires document code 4/N380 referencing the commercial invoice for customs value verification. Including the referenced invoices in the batch lets the extraction cross-verify the declared customs value against the invoice total — a reconciliation step that German customs performs during post-clearance audits. Define columns for both the declaration-level fields (MRN, tariff code, procedure code) and the supporting-document fields (invoice number, invoice total, supplier name). The AI extracts from whichever document carries each field.
What accuracy should I expect for handwritten or stamped customs declarations?
Printed ATLAS digital confirmations reach up to 99% field-level accuracy. Emergency fallback Einheitspapier forms with handwritten entries, customs stamps overlaying text, or manual corrections degrade proportionally. Tariff codes and customs values on clearly printed digital declarations typically pass through without requiring manual verification. Handwritten fields and over-stamped values should be spot-checked — particularly the Zollwert (customs value), where a misread digit changes the duty calculation. No extraction tool achieves 100% on degraded source documents; the realistic expectation is that printed fields pass through clean, handwritten fields require a second look.
Does the extraction validate tariff codes against the official German customs tariff (EZT-online)?
No. The extraction reads and transcribes the tariff code as printed on the declaration. It does not validate whether the code is correct for the described goods — HS classification is a legal determination governed by the General Rules of Interpretation and depends on product composition, function, and intended use. The extraction handles the transcription layer: accurately copying the code from the declaration into your summary table. Classification validation belongs to the compliance layer, performed by the importer or customs broker using the EZT-online database and, for binding determinations, the BTI (verbindliche Zolltarifauskunft) application process.
How does this compare to running a customs data report from my ATLAS software provider?
ATLAS software providers (DAKOSY, AEB, MIC-CUST) can generate transaction-level reports of declarations filed through their own system. The limitation is scope: a report only covers declarations filed through that specific software. If your company uses DAKOSY for sea-freight imports and files air-freight declarations directly through IZA, or if your freight forwarder files some declarations on your behalf using their own ATLAS interface, those declarations are invisible to a single-software report. The extraction approach is software-agnostic — any declaration you can obtain as a PDF, screenshot, or scan feeds into the same batch and produces output in the same structure.
Can the extraction distinguish between the importer of record (Einfuhrer) and the declarant (Anmelder) when they are different entities?
Yes. On German Zollanmeldung, the consignee (Empfänger) and declarant (Anmelder) can be different entities — common when a freight forwarder or customs broker files the declaration on behalf of the importer. The extraction captures the EORI number and name from both address blocks. For multi-entity importers managing declarations across subsidiaries with different EORI numbers, the EORI field enables per-entity filtering in the summary table.