How to Actually Test Document Extraction Accuracy
A Practical Guide for Anyone Evaluating AI OCR Tools
Every document extraction tool on the market says the same thing: "99% accuracy." The claim appears on vendor landing pages, in sales decks, and in product comparison tables. It's a number with no agreed-upon definition behind it — 99% of what, measured how, on which documents, under what conditions? This guide replaces that single marketing number with a framework you can use yourself. Here's what accuracy actually means at four different levels, which metrics predict real business outcomes, and a step-by-step protocol for running your own accuracy test — using free public datasets or your own documents — before you commit to any tool.
Key Takeaways
- When a vendor claims "99% accuracy," ask 99% of what — character-level, field-level, document, and straight-through-processing rates tell four different stories about the same tool.
- At 97% field accuracy on a 15-field invoice, more than one in three documents contains at least one error — the gap most teams discover only after the tool is deployed.
- Industry average straight-through processing sits at 32% — best-in-class AI extraction reaches 60–80%, eliminating roughly half of the manual review effort entirely.
- Testing 10 clean invoices produces accuracy numbers that predict nothing — a stable estimate requires 100+ documents across your actual vendor mix, including the worst-quality ones.
- Score headers, line items, and computed totals separately — averaging them together hides 85% line-item accuracy behind 99% header accuracy that looks good on a scorecard but feels different in daily operations.
Why "99% Accuracy" Is a Meaningless Number on Its Own
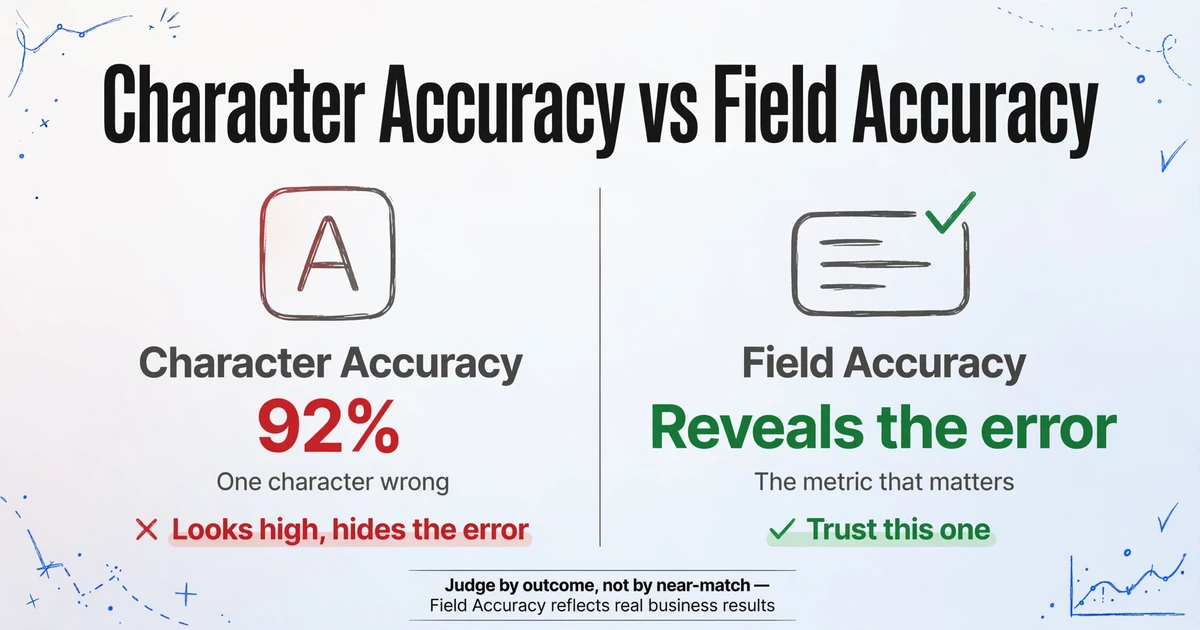
"Accuracy" in document extraction isn't one number — it's four different numbers that tell four different stories about the same tool. Most vendors pick the one that makes their product look best. Understanding which one you're being shown is the first step to evaluating any claim honestly.
Level 1 — Character accuracy (CER). What percentage of individual characters were read correctly? If a document contains 500 characters and the tool reads 495 of them correctly, character accuracy is 99%. Traditional OCR on clean printed text ranges from 85–97%; modern AI vision models reach 98–99.5%. This is the easiest metric to hit and the one most vendor claims are based on — but it's almost useless for business decisions. Consider a real-world example:
An invoice number "INV-20260412" gets read as "INV-2O260412" — one character wrong, 92% character accuracy on this field, sounds decent. But the field value is completely wrong for AP matching. Character accuracy told you the tool mostly got it right; the business outcome says it got it entirely wrong.
Level 2 — Field accuracy. A field is correct only when every character in that field is correct. One wrong character = the whole field fails. This is the metric that matters for operations. Traditional template-based extraction achieves 70–90% field accuracy across varied document sets because format variations break the templates. AI-based extraction achieves 95–99.5% field accuracy on standard business documents. At 98% character accuracy, a 10-character invoice number will be wrong roughly 18% of the time — character accuracy masks field-level failure.
Level 3 — Document accuracy. A document counts as correct only when every field on that document is correct. If you're extracting 15 fields per invoice and your field accuracy is 97%, the probability that all 15 fields are correct on any given invoice is 0.97^15 = approximately 63%. That means 37% of your invoices — over one in three — have at least one field error. A 97% field accuracy rate sounds impressive; a 63% document accuracy rate reveals how much human review is still needed.
Level 4 — Straight-through processing (STP). The percentage of documents that require zero human touch — no corrections, no review flags, no manual intervention. This is the number that directly maps to labor cost. Ardent Partners' 2025 AP metrics report pegs the industry average STP rate at 32.6%, Best-in-Class at 49.2%, and leading AI implementations at 60–80%. The gap between 32% and 80% STP represents roughly half of the manual review effort eliminated entirely. That's the number that shows up in your department's headcount and overtime — which is why it's the level that matters and the one vendors almost never publish.
When a vendor says "99% accurate," ask: 99% of what? Characters, fields, documents, or straight-through processing? The answer tells you whether the number means something or nothing.
The Only Three Numbers Your Business Actually Needs
Forget the marketing claim. When you're evaluating a document extraction tool for real operations, three metrics tell you almost everything you need to know — and none of them is the number on the vendor's homepage.
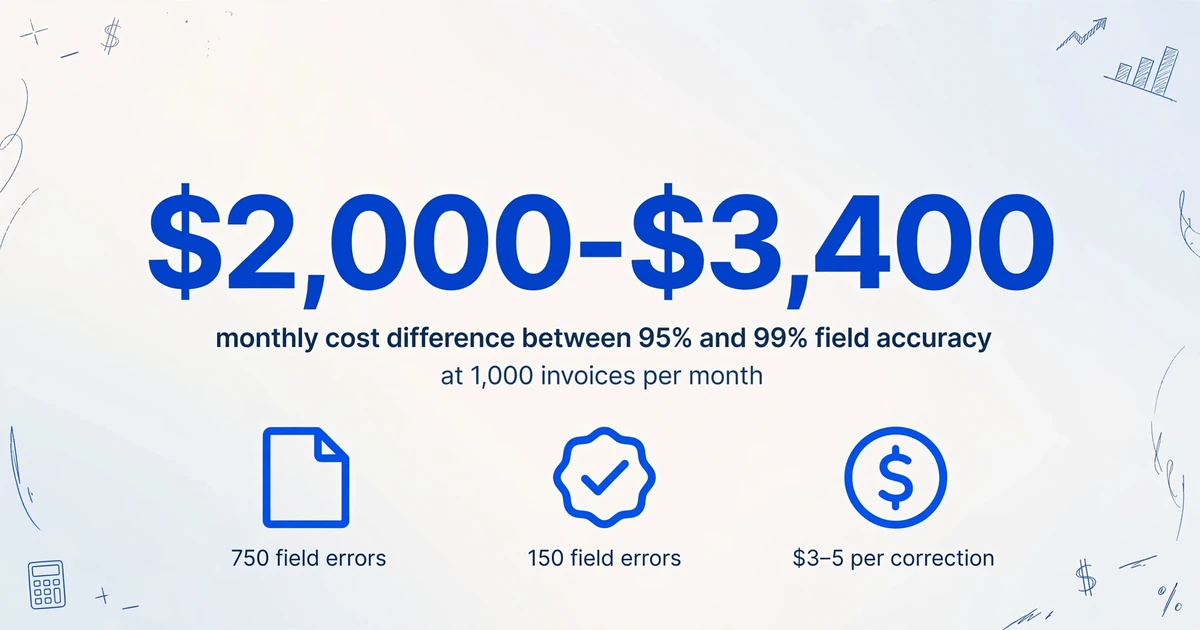
Field accuracy: how many corrections per day. For header fields — invoice numbers, dates, vendor names, totals — AI tools should hit 98–99%+ on clean documents. For line items — product descriptions, unit prices, quantities — 90–95% is a more realistic expectation because line items involve more text, more variation, and more formatting complexity. The practical question isn't "what's the field accuracy percentage" — it's "how many corrections will my team make per day at our volume?"
Document accuracy: how many invoices need any human touch. This is field accuracy compounded across all fields on a document. At 1,000 invoices per month with 15 fields each, the difference between 95% and 99% field accuracy is the difference between 750 field errors per month and 150 field errors per month. Each correction costs roughly $3–5 in labor (locate the error, check the source document, fix the cell). That's a $2,000–$3,400 monthly difference — on one metric, in one department.
STP rate: how many flow through untouched. Industry benchmarks from Ardent Partners put the cost picture in context: the average organization spends $9.40 to process a single invoice end-to-end, with an average processing time of 9.15 days and an exception rate of 14%. Best-in-Class organizations spend $2.78 per invoice, process in 3.1 days, and hit an exception rate closer to 5%. The difference between average and best-in-class isn't better people — it's higher STP rates enabled by automation that doesn't require humans to touch most documents.
These three metrics connect directly to cost in a way that a single "99%" claim never can. Field accuracy predicts daily correction workload. Document accuracy predicts how many invoices need review. STP rate predicts how much labor you can eliminate entirely. If a vendor can't or won't provide numbers at these three levels — measured on a test set you'd recognize as realistic — the accuracy claim on their landing page is answering a question your business isn't asking.
What to Test — and Why You Shouldn't Test Everything Equally
The natural instinct is to test all fields and average the results. That produces a number that looks clean but hides the difference between easy fields and hard ones — which is exactly the difference that determines whether the tool works for your workflow.
Not all fields are equally difficult to extract, and not all field failures carry the same business cost. A wrong invoice number means the payment can't be matched — high cost. A slightly truncated vendor name ("Acme Industrial Suppl" vs "Acme Industrial Supplies Inc") means someone squints at it for half a second — negligible cost. Treating both as equal errors in your accuracy calculation inflates the problem on vendor names and hides it on invoice numbers.
Break your test into three categories and score each separately:
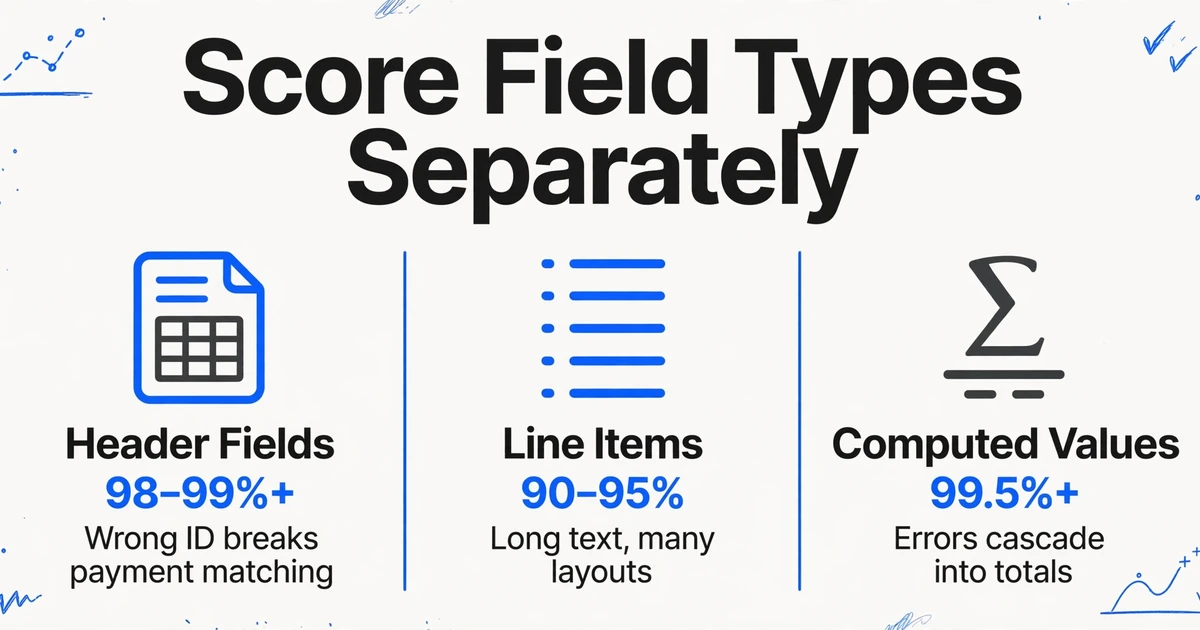
Header fields — invoice number, date, vendor name, PO reference, total amount, currency. These are typically well-labeled, consistently positioned near the top of the document, and use standardized formats. AI tools should hit 98–99%+ field accuracy on these. If a tool can't hit 95% on header fields, it's not ready for your production workflow regardless of what else it does well.
Line items — product descriptions, quantities, unit prices, line totals. These are harder because line item tables vary dramatically in structure, column labels differ by vendor, and product descriptions can be long free-text strings. AI tools typically achieve 90–95% field accuracy on line items. A tool scoring 92% on line items at 1,000 invoices per month with an average of 3 line items per invoice means roughly 240 line-item field corrections per month — about 12 per working day. Factor that into your staffing model.
Computed or derived values — subtotals that should equal the sum of line items, tax amounts that should match the stated rate, totals that should reconcile across sections. These are the fields where extraction errors cascade into financial discrepancies. Test them separately and set a higher bar: total amounts should be 99.5%+ accurate because a $1,590.00 invoice recorded as $15,900.00 is a much more expensive error than a misspelled product name.
What you don't want is a single "92% overall accuracy" number that averages 99% header accuracy with 85% line item accuracy. That average tells you nothing useful; the 85% on line items is what you'll feel in daily operations, and it's hidden inside the composite number. Score each category independently and compare tools category by category — not overall by overall.
Building Your Test Set: How Many Documents, What Variety, and Where to Find Them
A test set that doesn't look like your actual document mix produces accuracy numbers that don't predict your actual experience. The most common accuracy-testing mistake — testing on a handful of clean, familiar invoices and assuming the results generalize — is how teams end up disappointed in production.
How many documents you need depends on how uniform your document population is. If all your invoices come from a single vendor who never changes their format — homogeneous documents — 30 to 50 documents gives you a stable estimate. Your extraction accuracy won't vary much from document to document because the layout is consistent. If you receive invoices from dozens of vendors across multiple formats — heterogeneous documents — you need at least 100 documents. Each additional distinct layout type you want the results to represent adds roughly 20 to 30 more documents to the required sample. Below these thresholds, your accuracy measurement quantifies random variation, not tool performance.
Where to find test documents. The best test set is your own: grab your most recent 50 to 100 invoices, export them from your email or AP system, and annotate them. But if you're evaluating tools before you have volume — or you want a standardized baseline that lets you compare tools against the same documents — three public datasets are available for free:
- ICDAR SROIE (2019) — 1,000 scanned receipts with ground-truth labels for four fields: company name, address, date, and total. Widely used as a benchmark in academic OCR research. Good for testing receipt extraction; less useful for invoices with line items and tax breakdowns.
- Middlesex Invoice Document Dataset (MIDD, 2021) — 630 invoice PDFs across four layout templates with 11 labeled fields each. Closer to real AP workflows than SROIE because it's actual invoices, not receipts, and includes line item data. Published in the MDPI Data journal with full documentation of the annotation methodology.
- Innovatiana Historical Invoice Dataset — approximately 1,560 old invoice images with XML ground truth, released under CC0 Public Domain. The documents are historical rather than contemporary (older layouts, varying scan quality), which makes them useful for stress-testing how tools handle degraded input — but less representative of modern digital PDF invoices.
Public datasets are a useful starting point, but they have a limitation: they don't represent your specific vendor mix. The invoices your business receives — from your actual suppliers, with your actual industry's terminology and formatting conventions — won't look exactly like academic benchmark documents. Use public datasets to narrow your shortlist to two or three tools, then run a second round of testing on 30 to 50 of your own real invoices before making a final decision.
Running the Test: A Simple Four-Step Protocol
You don't need code, an API integration, or a data science background. A spreadsheet, a consistent scoring rule, and the discipline to test field types separately is enough to produce numbers you can trust. Here's the protocol.
Step 1 — Annotate ground truth. Create a simple spreadsheet with one row per document and one column per field you're testing. For each document, manually enter the correct value for each field — this is your ground truth. Be precise: if the invoice total is $1,590.00, write "$1,590.00" not "1590" or "~$1600." Inconsistency in your ground truth definition makes every downstream comparison invalid. For line items, annotate each line separately or choose a representative subset (the first three line items on each invoice, for example) rather than trying to annotate every line on every document — the latter is the kind of manual labor you're trying to eliminate.
Step 2 — Compare extracted vs. expected using consistent normalization rules. Before you score a single field, write down your normalization rules. Define what counts as a match. A reasonable starting set:
• Dates: normalize to YYYY-MM-DD, accept any input format as long as the date is correct ("01/15/2026" matches "Jan 15, 2026").
• Currency amounts: strip currency symbols, accept numeric equivalence ($1,590.00 matches 1590.00).
• Whitespace: strip leading/trailing spaces; "Acme Corp" matches " Acme Corp ".
• Case: case-insensitive matching for text fields; "ACME CORP" matches "Acme Corp."
• Partial vendor names: you'll need a judgment call here. "Acme Industrial Supplies Inc" and "Acme Industrial Suppl" — is that a match? Define your rule before scoring. Most teams accept truncated names that unambiguously identify the vendor; reject anything ambiguous.
The critical rule: apply the same normalization to every tool you test. If you're lenient with one tool's date parsing and strict with another's, your comparison is invalid. Same rules, same test set, same ground truth — every variation you introduce makes the results less comparable.
Step 3 — Score per field type separately. For each document, mark each field as correct (1) or incorrect (0). Calculate accuracy per field type: header accuracy = correct header extractions ÷ total header fields tested. Line item accuracy = correct line item extractions ÷ total line item fields tested. Totals accuracy = correct total extractions ÷ total total fields tested. Report three separate percentages, not one composite number. A tool with 99% header accuracy and 85% line item accuracy is a different tool — for your team's daily experience — than one with 95% header accuracy and 93% line item accuracy, even if their composite scores are similar.
Step 4 — Look for patterns in failures before looking at the aggregate scores. Don't stop at "92% line item accuracy." Look at which documents failed, which fields failed, and whether there's a pattern. Common patterns that matter: one vendor's invoices consistently fail (the tool struggles with that specific layout) → you'll need a workaround for that vendor. Phone photos of paper documents fail more than digital PDFs (image quality degrades extraction) → your field team's expense receipts will have lower accuracy than emailed invoices. Date fields fail at higher rates near month/year boundaries (models confuse issue date vs. due date on same-month invoices) → your month-end close batch will need extra review. If one field type fails consistently regardless of vendor — say, tax amounts are wrong 30% of the time — that's a tool limitation, not a document problem.
Patterns in failures are more actionable than aggregate scores. An overall score of 94% that hides a 60% failure rate on one critical field type is worse than an 89% overall score where the errors are evenly distributed across low-impact fields. The pattern tells you what the tool can and can't do; the aggregate score obscures it.
The output of a good accuracy test isn't a single number. It's a field-type-by-field-type breakdown that tells you exactly where the tool works, where it doesn't, and what your team's daily correction workload will actually look like.
Three Accuracy-Testing Mistakes That Make Your Results Useless
Most accuracy tests produce misleading results not because the measurement is hard, but because the test design assumes conditions that don't hold in production. Here are the three mistakes that most commonly turn a promising test result into a disappointing production deployment.
Mistake 1: Testing only clean, digital PDFs when your real mix includes phone photos and scans. A digitally generated PDF — crisp text, perfect contrast, no rotation — is the easiest possible input for any extraction tool. A photo of a paper invoice taken with a phone under office lighting — slight angle, some shadow, lower contrast — is the input your field team or remote employees actually submit. If your test set is 100 clean PDFs and your production input is 60% clean PDFs and 40% phone photos, your test overestimates accuracy by a margin that could be large. IBM's data on manual data entry finds error rates of up to 4% in supply chain contexts; STP automation can reduce that to approximately 1%, but only if the input quality matches what the tool was tested on. Build your test set to match your real input mix — including a representative share of the worst-quality documents you actually receive.
Mistake 2: Normalizing inconsistently across tools. If you accept "01/15/2026" as matching "Jan 15, 2026" for Tool A but require an exact string match for Tool B, your test doesn't compare tool accuracy — it compares your scoring generosity. The fix is simple but rarely done: write your normalization rules in a shared document before you run any extractions, and apply the same rules to every tool's output. Even small inconsistencies compound: if your normalization rules differ on five fields across 100 documents, that's 500 scoring decisions where bias (even unintentional) can tilt the results. Same rules, same ground truth, same test set. Lock all three before you extract a single document.
Mistake 3: Testing too few documents. Ten invoices from two vendors produce an accuracy number that tells you how the tool performs on those ten specific invoices from those two specific vendors — and nothing else. The confidence interval on a sample that small is wide enough to render the result meaningless. Twenty invoices from ten vendors is better but still noisy: one particularly tricky vendor that accounts for 3 of your 20 test documents can swing the aggregate accuracy by several percentage points. The sample-size rules from section four aren't arbitrary. Below 30 documents for a homogeneous set or 100 documents for a heterogeneous set, your accuracy measurement is measuring sample noise more than tool performance.
A fourth, subtler mistake is worth flagging even if it doesn't fit the testing protocol itself: testing only on documents where you already know the tool's expected output. This is the "document that looks like the demo" problem. Vendors' demo documents are selected to look good — clean layouts, standard formats, clearly labeled fields. Your worst invoice — the one from the vendor who uses a three-column landscape layout with handwritten notes in the margin — is the one that determines whether your team trusts the tool or bypasses it. Include your worst documents in the test set. A tool that handles them passably and your clean documents perfectly is more useful than one that's marginally better on clean documents and falls apart on the difficult ones.
Interpreting Your Results: What's Good Enough for Your Use Case
You have numbers. Now you need to decide whether they justify switching from your current process. The answer depends on what you're using extraction for — the same accuracy that's unacceptable for financial reporting may be perfectly fine for data entry replacement. Here's how to interpret results by use case.
Pure data entry replacement: you're replacing a person who types invoice fields into a spreadsheet. At this use case, 95%+ field accuracy on header fields is acceptable — you're still getting 19 out of 20 fields right automatically, and the correction workload on the 20th is trivial compared to typing all 20. Line item accuracy of 90%+ is workable because the alternative is typing every product description, quantity, and unit price by hand. The benchmark here is your current process — manual entry with its own 1–4% error rate. AI extraction at 95%+ is better than manual entry on both speed and accuracy.
PO matching and AP automation: you need invoice amounts, PO numbers, and vendor names to match exactly against purchase orders in your ERP. Amount fields need 99%+ accuracy because a mismatched amount breaks the match and requires a human to investigate. Header fields need 98%+ because a wrong PO number sends the invoice to the wrong approval queue. At 95% field accuracy on 1,000 invoices per month, you're looking at roughly 50 amount-related mismatches monthly — each one a manual investigation. The economics shift at 99%+ where that number drops to 10 or fewer.
Financial reporting and compliance: line item accuracy becomes the critical metric because line items feed into cost allocation, tax reporting, and audit trails. A 92% line item accuracy on 1,000 invoices averaging 3 line items each means roughly 240 line-item errors per month — about 12 per working day. For month-end close, those errors need to be found and corrected before numbers are reported. If line item accuracy is below 95% and your team is responsible for financial reporting based on extracted data, budget for a verification step.
Mixed workflows (the most common case): most teams don't fall cleanly into one category. You might need 99%+ on amounts and PO numbers for AP matching, but 90%+ on product descriptions is fine because descriptions are for internal reference, not reconciliation. This is why testing each field type separately matters: you can accept lower accuracy on low-impact fields while holding the line on high-impact ones. A tool that's 85% accurate on product descriptions and 99.5% accurate on amounts may be a better fit than one that's 92% across the board — but you can only make that call if you scored them separately.
Ardent Partners' cost data provides a useful reality check: at $9.40 per invoice average process cost, even modest STP improvements compound meaningfully. Moving from 32% STP (industry average) to 50% STP on 1,000 invoices per month means 180 fewer invoices requiring manual touch — and at 5–8 minutes of manual review per invoice, that's 15 to 24 hours of labor recovered every month. The accuracy percentage that unlocks that STP improvement depends on your document complexity and error tolerance, not on a generic benchmark. Run the test on your own documents and calculate the labor recovery at your actual volume and your actual error tolerance. That number — not any vendor's claim — is your ROI.
FAQ
I only have 20 of my own invoices. Is that enough to test?
Twenty invoices from a single vendor or format gives you a directional sense — enough to catch glaring problems — but not a stable accuracy estimate. The confidence interval on a sample that small is wide: a 95% measured accuracy could mean the true accuracy is anywhere from 85% to 99%. At a minimum, supplement your 20 invoices with one of the public datasets (SROIE or MIDD) to get to 50+ documents. Better: collect 50 of your own invoices — even from just 3 to 5 vendors — before trusting the results. The sample size threshold is the difference between "this tool seems fine" and "I know what my team's correction workload will be."
Should I test handwritten documents separately?
Yes. Handwriting introduces a different error profile — character confusion (1 vs. 7, 0 vs. O), inconsistent spacing, and variable legibility across writers — that doesn't apply to printed text. A tool that achieves 98% field accuracy on printed invoices may drop to 70–80% on handwritten forms. If handwritten documents are part of your actual document mix (delivery receipts, field inspection forms, handwritten purchase orders), build a separate test subset for them and score it independently. Averaging handwritten and printed accuracy together hides the degradation — you want to know whether the tool is usable on handwriting at all, not whether it averages out to acceptable.
What about non-English invoices?
Most AI vision models (GPT-4o, Claude, Gemini) handle major languages — Spanish, French, German, Japanese, Chinese — as well as they handle English, because the underlying training data is multilingual. Field names in different languages ("Numéro de facture," "Rechnungsnummer," "請求書番号") are recognized as equivalents to "Invoice Number" by the model's semantic understanding. Where accuracy degrades is on languages with smaller training data footprints and on documents where the layout conventions differ significantly from Western invoice formats — some Asian invoice formats, for example, use vertical text flow or table structures that differ from the left-to-right, top-to-bottom layout the models are predominantly trained on. If your document mix includes a significant share of non-English invoices, include a representative sample in your test set rather than assuming English-language results transfer.
Do I need to re-test after the tool updates?
For traditional OCR and template-based tools, updates usually don't change extraction behavior on existing templates, so re-testing isn't necessary. For AI-based tools, underlying model updates can change extraction behavior — sometimes improving accuracy, occasionally introducing regressions on edge cases. A lightweight re-test on a 10-document subset after major model updates is a reasonable practice if your workflow depends on high accuracy for financial or compliance purposes. You don't need to rerun the full 100-document protocol each time; a quick check on your most representative and your most problematic documents will catch regressions that matter.
How do I compare two tools fairly?
Same test set, same ground truth annotations, same normalization rules, same scoring methodology. If you test Tool A on the first 50 invoices in your folder and Tool B on the second 50, you haven't compared tools — you've compared two different test sets. Create one annotated test set, run both tools against it, and score both using identical rules. If Tool A supports a feature Tool B doesn't (like automatic date normalization), apply the normalization rule you defined before testing — don't give Tool A credit for a feature by relaxing the scoring standard. The goal is a comparison of extraction accuracy under equal conditions, not a comparison of post-processing features.
What if the tool has a confidence score feature?
Confidence scores — where the tool flags low-confidence extractions for human review — can significantly reduce the manual correction burden if the scores are reliable. A tool that achieves 95% field accuracy but correctly flags 80% of its errors with low confidence scores effectively turns a 5% error rate into a 1% uncaught error rate (the 20% of errors it didn't flag). Test confidence scores as part of your evaluation: for the fields the tool flagged as low confidence, what was the actual error rate? For the fields it flagged as high confidence, were any of them wrong? A confidence score system that's poorly calibrated — flagging correct extractions as low confidence (false positives that waste review time) or missing actual errors (false negatives that pass bad data through) — is worse than no confidence system at all because it creates a false sense of security.
The best accuracy number is the one you measured yourself — on your documents, with your field definitions, scored against your tolerance for error. Every tool in this market can find a way to claim 99% of something. The question isn't what they claim. It's what you can verify, on the documents that actually land in your inbox, for the fields your team actually needs.
If you're evaluating extraction tools and want to put this protocol into practice, ImageToTable.ai runs on a visual LLM that extracts by field semantics rather than template coordinates — meaning you define the fields you want once and the same extraction works across any vendor's layout. The AI vs. traditional OCR comparison covers the architectural difference that makes this possible, the document extraction concept guide explains how field-level semantic extraction differs from character-level OCR in practice, and custom column extraction shows how you define which fields to test in the first place. Run the test protocol, score each field type separately, and see whether the numbers match the claims.
Upload your own documents and test field-level extraction yourself — no setup, no templates, no training data required.
Try ImageToTable.ai Free