ESG Data Collection Starts
in the Documents
Most ESG figures in a sustainability statement have a document behind them, and that document was designed for something else. The kilowatt hours came off a utility bill built to collect payment. The supplier's emissions number came back on a questionnaire filled in to keep a customer. The refrigerant top-up sits on a service work order. None of these was created to be reported, which is why the collection step is where reporting timelines slip.
PwC's 2024 Global CSRD Survey found that 59% of executives rank data availability and quality as the biggest obstacle to implementation. The same survey found 74% still using spreadsheets for sustainability reporting, against 26% using a centralized sustainability data store. The bottleneck is not the calculation. It is getting a number you can trace out of a file and into a row.
Key Takeaways
- 61% of the figures a mandatory ESG report asks for were cut in 2026, and the document work stayed exactly the same.
- A report figure is only a question on a form, while one energy number still needs twelve months of bills from every site.
- One row per figure, with unit, basis, period and source page, turns a reviewer's question into a five-second answer.
ESG data collection is the work of turning documents into a dataset
ESG data collection is the process of gathering environmental, social and governance metrics from across a business, then consolidating them into a dataset that can be checked against a reporting framework. Reporting is the step after that, where the numbers are written into a disclosure. Carbon accounting is another step again, where activity data is multiplied by emission factors. Collection is the step that depends on documents, and it is the one that consumes the calendar.
Before any document is opened, someone has to decide which metrics are material and which entities are in scope. That decision belongs to the sustainability lead and, under CSRD, to the double materiality assessment. This article starts after it: the metrics are known, and the documents are the problem.
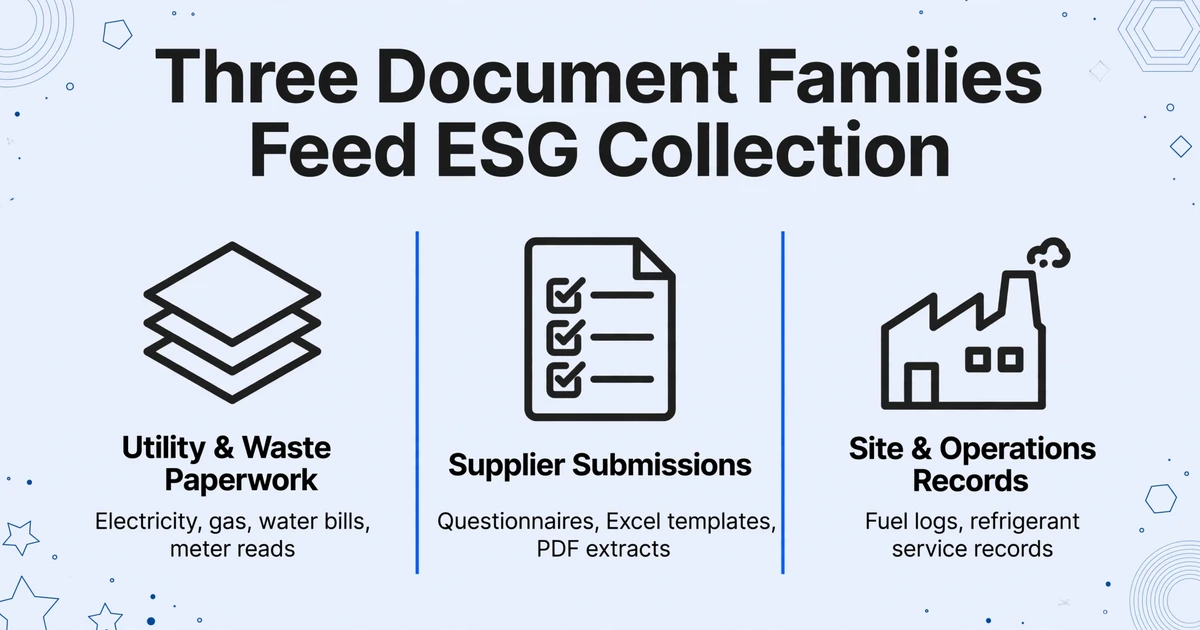
Three document families feed almost every collection cycle. Each one carries a different kind of number, and each one fails in its own way.
| Document family | What arrives | What it feeds |
|---|---|---|
| Utility and waste paperwork | Electricity, gas and water bills, meter reads, waste hauler invoices, sewer charges | Scope 2 activity data, water withdrawal, waste tonnage, cost and consumption intensity |
| Supplier submissions | Questionnaires, Excel templates, PDF extracts of a GHG inventory, assessment scorecards, evidence packs | Scope 3 activity and emissions, supplier risk, value-chain boundary |
| Site and operations records | Fuel logs, refrigerant service records, waste transfer notes, inspection forms, production output | Scope 1 activity, refrigerant losses, waste destination, intensity denominators |
Social and governance metrics arrive the same way, through a different door: headcount and injury logs from HR, training records, policy documents, board minutes. The fields change. The collection problem does not.
Site records are the family most likely to still be on paper. If the inspection forms and field logs are handwritten, the retyping step is the same problem in a different uniform; the environmental field data workflow covers the capture side.
Four people usually touch each number, and most failures happen between them. The site or facility manager holds the bills and the logs, and signs the site report. The supplier contact answers the questionnaire, often without knowing which facilities the buyer considers in scope. The sustainability lead owns the reporting boundary and the master dataset. The finance controller owns the control environment and signs the number that enters the annual report. A number can be correct at every one of those desks and still be wrong by the time it reaches the report, because a qualifier was dropped at a handoff.
The output of collection is not a number. It is a number plus the period, unit, boundary and source document that make it mean something.
In practice, the stack is often a spreadsheet alongside a reporting or carbon platform such as Workiva, Persefoni or Watershed, with supplier assessments arriving through EcoVadis, CDP or a customer's own procurement portal. The platform holds and calculates structured data. It still needs the kWh to arrive as a value with a unit.
The reporting template got smaller in 2026; the document work did not
The 2026 revision did not remove the documents behind the core numbers, even after it cut the disclosure list. The Omnibus package pulled a large share of companies out of mandatory CSRD scope, and limited assurance remains in place (Commonwealth Climate Law). For companies still in scope, the revised European Sustainability Reporting Standards, published in September 2026 as Delegated Regulation (EU) 2026/1563, apply to financial years beginning on or after 1 January 2027 (Linklaters), with 61% fewer mandatory datapoints than the 2023 set (EY).
It is reasonable to read that as less work. The datapoint count is not the work. One energy figure still needs twelve months of bills from every site, a decision about the estimated reads, and a page reference for the reviewer. Cutting datapoints removes questions from the template. It does not remove the kWh from the bill.
Two things keep the document layer in place. Companies outside the mandatory scope still get asked for the same numbers by customers and lenders, often through a voluntary standard or a procurement questionnaire. Companies inside it still face limited assurance, which means someone will sample a figure and ask to see where it came from.
A shorter questionnaire changes what you disclose. It does not change where the number comes from.
The same metric usually exists in two records, and the two disagree for structural reasons
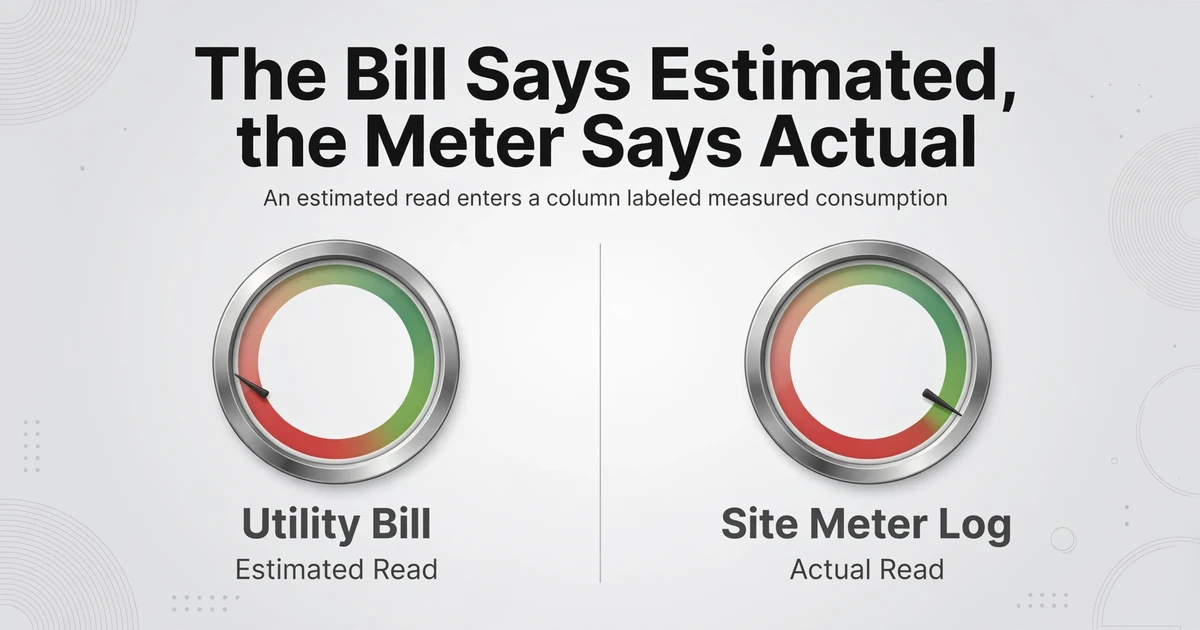
The conflict that does the most quiet damage is between the utility bill and the site's own meter log. A bill can carry an estimated read, calculated from the same period last year and adjusted for weather, and it is usually marked as estimated near the reading (Washington Gas). The site manager's photo of the meter is an actual read. The person assembling the dataset takes the bill, because the bill is the invoice, it is already in the folder, and nobody has to chase the site for a photo. An estimated value enters a column labeled measured consumption, and nothing in the spreadsheet records that it was an estimate.
The second conflict is ownership. A landlord's master meter can cover three tenants, with each tenant's share allocated by floor area or by a submeter. The site's kWh is then a model, not a measurement, but it arrives on a utility bill, so it gets treated like one. The building's total consumption is real. The tenant's slice is an allocation, and the two cannot both be entered as measured site data without double counting somewhere in the portfolio.
The third conflict is between a supplier's answer and the supplier's own evidence. A supplier returns 12,400 MWh for electricity and notes on page 3 that the figure covers 8 of its 11 facilities. The buyer's template has one field for annual electricity, so 12,400 becomes the supplier total. It is a partial number in a total's clothing, and every intensity ratio built on it inherits the gap.
None of these is a typing mistake. In each case the correct value was available and a plausible value was easier to file. The qualifier sat in a footnote, the allocation method sat in a lease, the boundary sat on page 3, and the spreadsheet had no column that asked for it. By the time the number reaches the report, the person who could have explained it has moved to another project.
Practitioners describe the problem the same way. In a thread on r/environmental_science about CBAM reporting, the distinction drawn was between collecting the numbers and building an audit trail that connects each one back to its source (the thread). The first is a week of work. The second decides whether the number survives review.
Unit and period errors survive review because the number still looks plausible
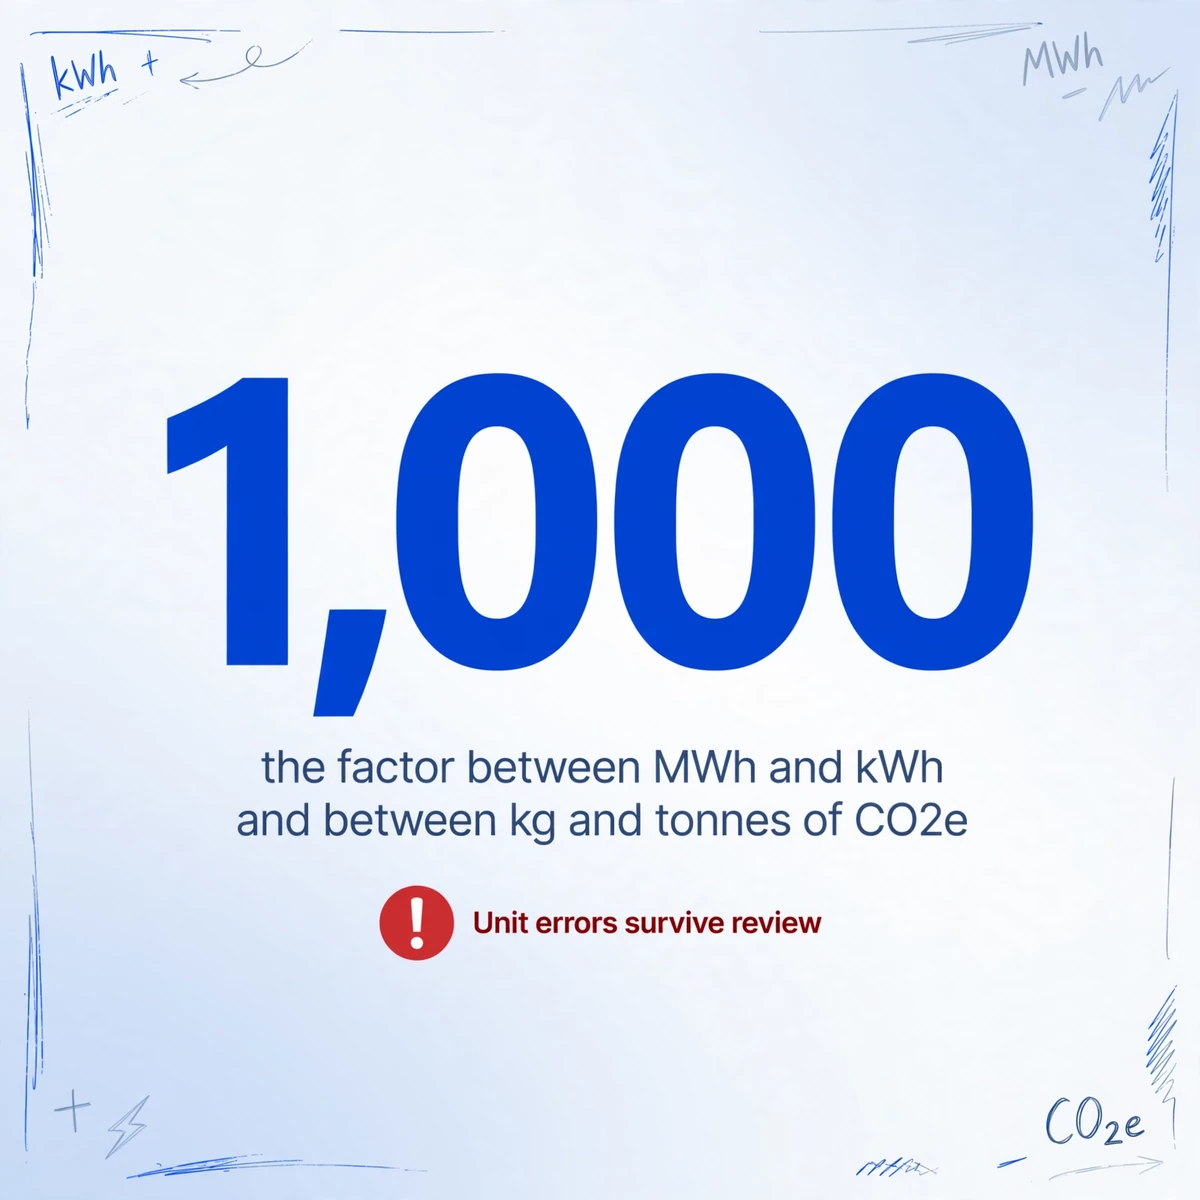
Scope 1 and Scope 2 data collection concentrates errors in two places, the unit and the period, and neither announces itself. A supplier that reports 12,400 MWh and a template that expects kWh differ by a factor of 1,000, and 12,400 is an ordinary number in either column. The same is true of kilograms and tonnes of CO2e, also a factor of 1,000. Gas adds a third mismatch between cubic feet and cubic meters.
Gas is the messiest unit family. Meters are read in volume, and the utility converts that volume to therms using a heat-content factor that reflects the gas supplied. The bill usually shows the arithmetic as CCF multiplied by a therm conversion rate. That rate is not a fixed national constant, so normalizing with a single remembered factor can make a year of gas data drift by a few percent without any single bill being wrong. The unit is only one of the fields a bill carries; the charge stack, meter number and billing period each need their own column, which is why a utility bill needs its own column set rather than an invoice template.
Electricity has a different trap. A bill gives one kWh number, but a Scope 2 disclosure can require two results. The location-based method uses the average grid factor where the electricity was consumed. The market-based method uses the supplier's contractual instruments, such as renewable energy certificates or a green tariff. The GHG Protocol Scope 2 Guidance requires dual reporting where those instruments exist. If your table has one Scope 2 column, someone has to choose a method, and the choice disappears from the dataset. ESRS E1 asks for energy in MWh and for both Scope 2 methods (EFRAG), so the required output unit and the printed bill unit differ by design.
Period is the other silent variable. Utility billing cycles do not end on 31 December. A bill that covers 15 December to 14 January straddles two reporting years, and a site with 12 monthly bills can still produce 13 service periods in a calendar year. One month is about 8% of a year, so dropping a straddling bill is not a rounding error. The usual fix is to prorate by days, which is defensible if the proration is written down and applied the same way at every site. What is not defensible is choosing 12 bills because 12 looks tidy, then calling the total annual consumption.
If the unit, the method and the period are not in the row, the value is a number without a meaning.
A defensible dataset stores one row per data point, with the evidence attached to the value
It is long rather than wide: one row per data point, with the qualifiers in their own columns. The instinct is to build one sheet per document type, a bill sheet, a supplier sheet, a site sheet. That works for extraction and fails for reporting, because a bill produces electricity, gas and water, and a supplier questionnaire produces twenty metrics with different units.
The fields below are the difference between a data point and a number in a cell.
| Field | What it holds | Why it has to be its own column |
|---|---|---|
| Reporting entity | The legal entity the number belongs to | Acquisitions and boundary changes break comparability if the entity is implicit |
| Site or facility ID | A stable internal ID | The name on the bill changes; the ID is what joins records across years |
| Metric | A controlled name, such as Electricity consumption | Synonyms split one metric into three and quietly shrink the total |
| Value | A number with no unit text inside it | Mixed text blocks sums, sorting and validation |
| Unit as reported | kWh, MWh, therms, CCF, kgCO2e, tCO2e | Overwriting it with a target unit destroys the audit trail |
| Period start and end | The service period, not the bill date | Bill date and service period can be weeks apart |
| Basis | Actual or estimated; location or market; facilities covered | This is the field that separates measured data from modelled data |
| Source document | File name and page | Turns a reviewer's question into a five-second answer |
| Conversion | Factor used and where it came from | Reproducible totals require the same factor next year |
| Reviewed by | Name and date | Shows the check happened, and who to ask about the row |
This looks like more work than a wide sheet. It is less work at the point that matters. When a reviewer asks why the 2025 electricity total is 4% above the previous year, you filter one metric, sort by site, and see which rows changed basis. On a wide sheet you reconstruct that from memory, usually while the reviewer waits.
Keep the extraction output in whatever shape each document family produces. The long table is the layer above it, and it is the one you hand to a reviewer. The same structure is what turns a stack of plant inspection reports into a compliance summary you can compare month by month, instead of a filing cabinet.
Column-name extraction removes the typing step without flattening the fields that matter
Column-name extraction removes the retype step because the column name, not the layout, tells the AI what to find. Custom Column Extraction is the mechanism. You type the column names you want, including the qualifiers, and the AI reads each document and fills the value under the matching column by understanding what the label means. The names you type become the headers of the output. There is no template to draw per utility or per supplier, and one batch can mix layouts because the reading is semantic rather than positional.
Applied to ESG collection, the method is one column set per document family, not one column set for everything.
Define the family columns before uploading
For bills: site ID, provider, utility type (options: Electricity / Gas / Water / Waste), billing period start and end, usage as printed, unit as printed, reading type (options: Actual / Estimated), demand in kW, total charges.
For supplier submissions: supplier, reporting year, metric, value as reported, unit as reported, facilities covered, Scope 2 method, data status (options: Measured / Estimated / Calculated), evidence attached.
For site records: site ID, log date, activity type, quantity, unit, recorded by, work order number.
Upload one family as one batch
Batch processing accepts multiple files and returns a single Excel table with one row per file. A statement that runs across pages can be folded into one row with the Multi-Page Merge setting, instead of producing three partial rows that someone has to recombine by hand.
Use inference for classification, not for measurement
An inferred column with a fixed option list, such as Utility type (options: Electricity / Gas / Water / Waste), assigns a category the document may not print. Check a sample, because a classification error repeats across every row it touches rather than appearing once.
Review with the source visible
Review Mode with Bbox highlighting shows the region of the original document behind a cell, and an edited cell can be reverted to the AI's original value. Turn on auto-annotate for a reporting batch so the check is ready when the row is reviewed.
Files are processed securely and not stored.
The settings matter more than the model. A batch defined with unit as printed and reading type produces a dataset that can be audited. The same batch without those two columns produces cleaner-looking rows that fail the first review. If this is the first document workflow you are automating, a practical checklist for starting data-entry automation helps choose which family to begin with.
Four controls turn extracted rows into evidence
The four controls are the unit, the basis, the source page and the conversion log, and each one answers a question a reviewer will ask.
Keep the printed unit next to the value. Add a normalized column and a conversion factor column rather than overwriting what the document said. If a supplier reports MWh and your table needs kWh, the row should show both, plus the factor and its source.
Record the basis on every row. Actual or estimated, location or market, facilities covered or full boundary. A blank basis is not neutral. It means the reader will assume the most favorable interpretation, and the reviewer will assume the least favorable one.
Carry the source page. File name and page in the row. This is the difference between answering a reviewer in five seconds and re-reading 200 PDFs to find one number.
Log conversions and reviews. Factor, source, date, reviewer, kept with the dataset rather than in someone's inbox. Next year's team will need to reproduce the number, and the person who built the sheet may not be there.
Then sample. Check every row where the unit changed, every row flagged estimated, and a random slice of the rest. Bbox makes a sample check fast because the source region appears beside the cell. It does not replace the sample, and it does not record who approved what.
Extraction stops where ESG judgment begins
ImageToTable.ai handles ESG data extraction and standardization at the document level. It does not calculate emissions, choose emission factors, assign ESG ratings, run a double materiality assessment, or produce a CSRD, GRI or ISSB report. It does not decide whether a supplier's 8-of-11 boundary is acceptable, whether an estimated read should be replaced with an actual one, or whether two sites belong to the same legal entity. Those are judgments about the data, and they stay with the sustainability lead and the finance controller.
It also does not reconcile records across documents. A computed column can compare values inside one document, such as a bill total against the sum of its line items, and it can apply a fixed conversion. It will not notice that the meter log and the bill disagree, because that comparison spans two files and needs a rule about which one wins. Write that rule down before the first batch, not after the first audit question.
A visual bbox check is not an audit trail either. It shows where a value came from on the page. It does not give you an immutable change log, an approval chain or a sampling report. If you need those, they belong to your reporting platform or your internal control process.
The tool also reads documents, not spreadsheets. A supplier that returns a completed Excel file has already done the structuring. Use that file directly, or print it to PDF if you want the values re-checked. Uploading an XLSX is not what this tool does, and pretending otherwise would waste your afternoon.
Frequently asked questions
Can it handle utility bills from dozens of providers in one batch?
Yes. Because the columns are matched by meaning rather than by position, a batch can mix a municipal water statement, a cooperative gas bill and an investor-owned electric bill. Each file returns one row. The columns still have to ask for the unit and the reading type, or the batch will return clean-looking values that cannot be compared.
What if a supplier returns the questionnaire as an Excel file?
Excel is not an input format for ImageToTable.ai. If the supplier has already filled in your template, use the file directly and validate it in the spreadsheet. If the values need to be re-read from a source, export or print the sheet to PDF and process that. PDFs, scans, screenshots and photos are the formats the extraction step handles.
How should we handle a supplier that reports MWh when we asked for kWh?
Capture the value and the unit exactly as reported, then convert in a separate column with a documented factor. Do not retype 12,400 MWh as 12,400 kWh. The printed unit is the only evidence that the conversion was needed, and it is the first thing a reviewer will ask about.
Does it calculate Scope 1 or Scope 2 emissions?
No. It extracts activity data: kWh, therms, liters of fuel, kilograms of refrigerant, tonnes of waste, and the periods they cover. Turning that into CO2e requires emission factors and boundary decisions, which sit with your carbon accounting process or platform.
Can we prove where a reported number came from?
You can see which region of which page a value was read from, using Bbox highlighting in Review Mode, and you can keep the source file name and page in the row. That is document-level traceability. It is not an approval log or an assurance opinion, and it should be combined with your own review sign-off.
Is this worth it for 30 utility bills a year?
At 30 bills with a stable format, manual entry is reasonable, and a checklist may be the better investment. The case strengthens with multiple sites, multiple suppliers, quarterly reporting, staff turnover, or a reviewer who wants a source page for every figure. Start with one document family and measure how many rows come back needing correction.
A sustainability statement is a summary of documents. If every figure can be traced to a page, the summary holds. If it cannot, the number is a claim.
Start with the family that causes the most rework, usually utility bills. Give it a column set that carries the unit, the reading type and the source page, run one month through a batch, and see how much of the review is reading versus checking. Try it on one month of bills