What Manual EOB Data Entry Costs
Small Medical Billing Companies Per Claim
The 2023 CAQH Index, the healthcare industry's benchmark for administrative transaction costs, pegs a single manual remittance advice at $5.14. That number is just the labor—the time a biller spends reading the document and typing data into the system. It does not include the practice management software you pay for every month, the clearinghouse fees on every transaction, or the cost of fixing the 12 to 15 percent of claims that come back denied. For a small billing company processing 500 paper or PDF EOBs per month, the real per-claim cost is closer to $3.50 to $5.50 once all line items are accounted for—and that adds up fast.
Key Takeaways
- Half a biller's shift spent typing, not collecting. At 5 to 8 minutes per paper EOB (the insurer's Explanation of Benefits document), even 30 claims consume up to 4 hours — half the working day. Denial analysis and underpayment recovery, the work that actually protects revenue, get squeezed into whatever time remains.
- Your practice management system cannot read a PDF. PM platforms auto-post electronic remittances but go blind when secondary payers or workers' comp mail a paper EOB — the data flow stops at the inbox. A human has to bridge the gap, typing claim numbers, allowed amounts, and adjustment codes one field at a time.
- Above 300 paper EOBs per month, manual entry costs more than extraction. ImageToTable.ai reads any payer's EOB layout by column name in seconds instead of minutes, shifting the biller from typing to verifying. Underpayment recovery alone — clawing back just a fraction of the 7–15% of payments accepted without appeal — can cover the full cost of the tool.
What a single EOB costs, line by line
The per-EOB cost is not one number—it is four line items stacked on top of each other. Most billing company owners track only the first one, and even then, they tend to underestimate it.
An EOB, short for Explanation of Benefits, is the document an insurance company sends after processing a healthcare claim. It breaks down what was billed, what the plan covered, what the insurer paid, what was adjusted or denied, and what the patient owes. For providers who have not enrolled in electronic remittance advice with every payer—or who receive paper EOBs from secondary payers, workers' compensation, or state Medicaid programs regardless—each of these documents must be opened, read, and manually entered into the practice management system. This is the task that drives the per-claim cost.
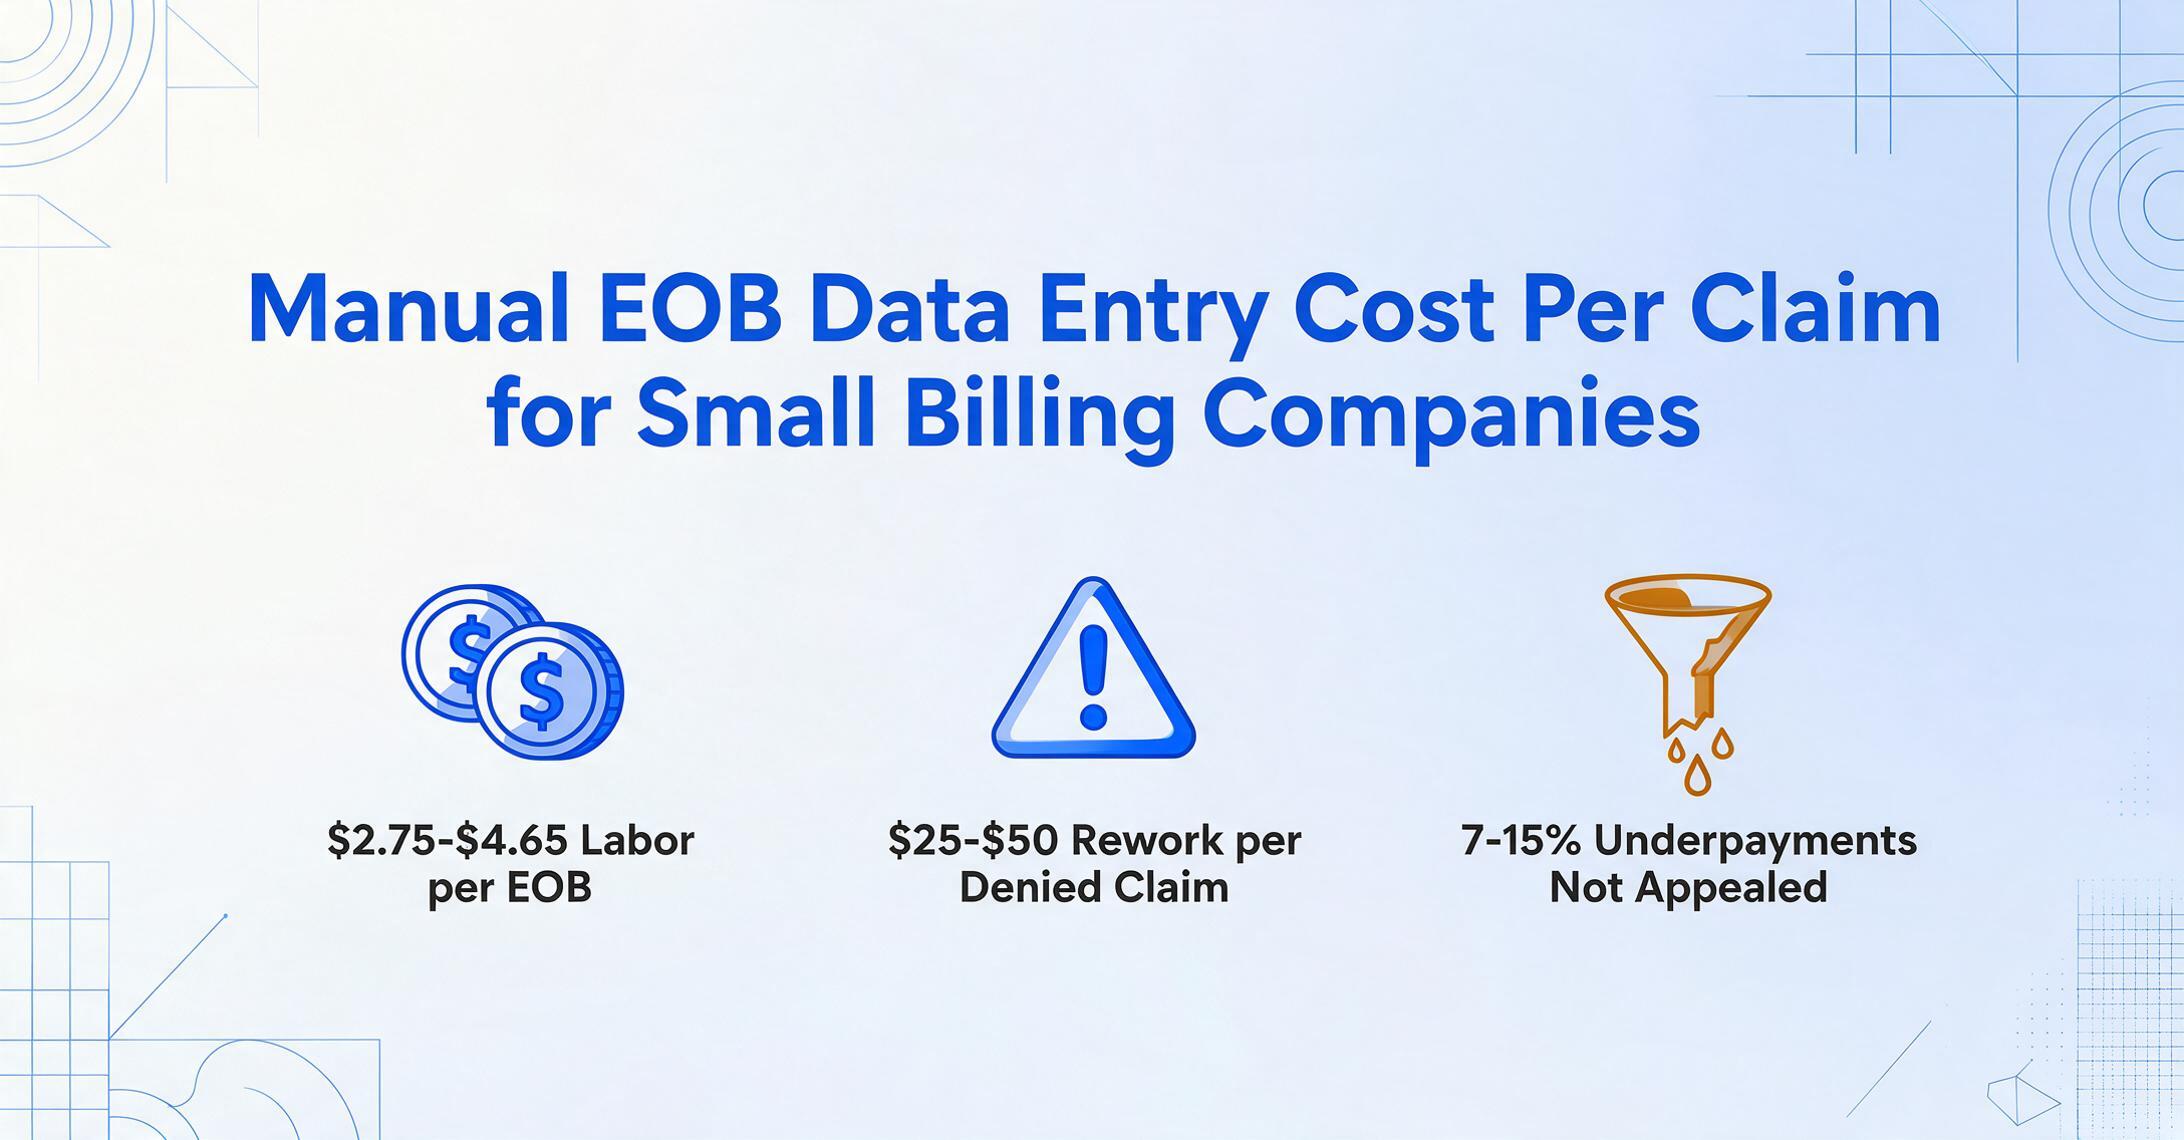
Line 1: Labor per EOB. The median annual wage for medical records specialists—the BLS category that includes medical billers—was $50,250 in May 2024, according to the Bureau of Labor Statistics. In physician offices, the median is lower at $45,620. Add payroll taxes, health insurance, PTO, and workers' compensation, and a biller's fully burdened cost runs roughly 25 to 30 percent above base salary—approximately $33 to $35 per hour. Manual EOB data entry takes 5 to 8 minutes per document, which puts the labor cost at $2.75 to $4.65 per EOB, consistent with the CAQH Index figure of $5.14 for manual remittance advice processing when factoring in the additional minutes of portal login, claim lookup, and reconciliation that wrap around the data entry itself.
Line 2: Technology overhead per EOB. The practice management software and clearinghouse that every billing company runs on are fixed monthly costs, but they can be allocated per claim. PM software from AdvancedMD runs $429 to $729 per provider per month. Tebra (the combined entity of Kareo and PatientPop) ranges from $150 to $500 per provider per month. Clearinghouse fees from Waystar run $0.20 to $0.35 per claim; Office Ally starts free for claims with ERA at $35 per month. Amortizing the software subscription across monthly EOB volume adds roughly $0.40 to $0.80 per EOB for a small billing company. This is money you are already spending—it does not go away. What matters is whether the tool you are paying for actually solves the EOB data entry problem, or just moves claims from A to B while leaving the data extraction to your staff.
Line 3: Error cost per EOB. Nationally, medical claim denial rates have climbed to 12 to 15 percent, according to industry data tracked by the Medical Group Management Association, with a March 2024 MGMA poll finding that 60 percent of medical groups report higher denials compared to the prior year. Each denied claim costs $25 to $50 in staff time to rework and resubmit. If manual EOB data entry introduces errors in even 5 percent of postings—conservative for a manual workflow—the amortized cost per EOB is an additional $0.15 to $0.30. This number is small per claim only because it is averaged across all claims; the few that break carry a much higher individual cost.
Line 4: Unrecovered underpayments. The MGMA reports that practices accept underpayments on 7 to 15 percent of paid claims without appealing them. A manual EOB review process, where billers are racing through stacks of paper, makes it easy to overlook a payer applying the wrong contracted rate or omitting a line item. This is harder to quantify per EOB but represents a structural leak that automation helps close—allocating roughly $0.10 to $0.25 per EOB when distributed across monthly volume.
Total manual cost per EOB: $3.40 to $6.00. At 500 EOBs per month, that is $1,700 to $3,000 per month—$20,400 to $36,000 per year—just for the task of reading documents and typing numbers from one system into another. At 1,000 EOBs per month, the annual cost doubles. This is not a staffing budget problem. It is a data entry problem.
The labor line — more than salary
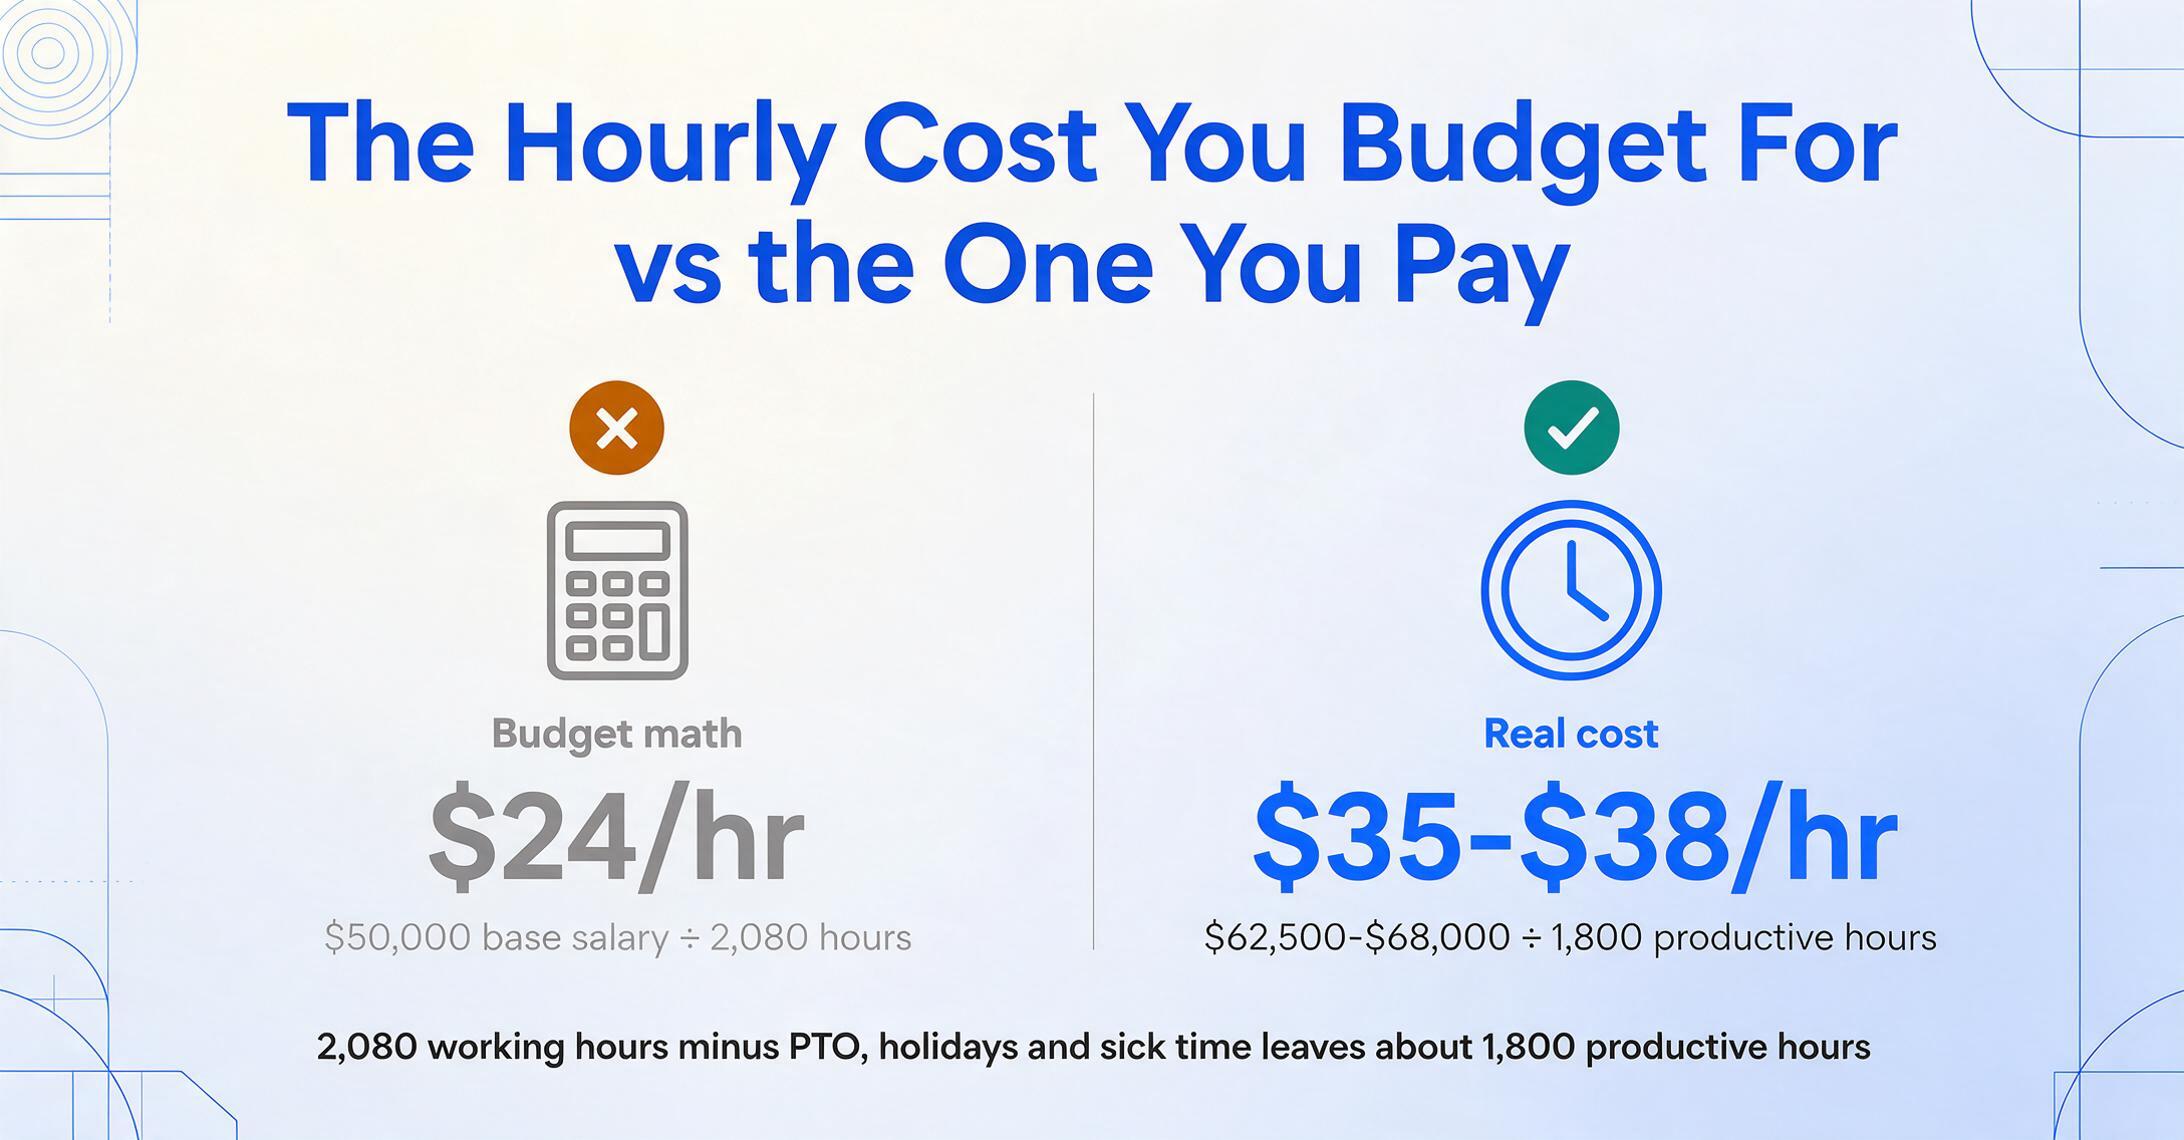
The single largest cost line is not a BLS median wage—it is the gap between what a biller costs per hour and what you actually get in productive output per hour. A biller with a $50,000 base salary costs the company roughly $62,500 to $68,000 fully burdened. At 2,080 working hours per year, minus four weeks of PTO, holidays, and sick time, the actual productive hours are closer to 1,800. That yields an effective hourly cost of $35 to $38, not $24.
Now consider what a biller at a small billing company does with those hours. EOB data entry is one task among many: claim submission follow-up, denial research, patient statement calls, payer portal checks, credentialing paperwork. A biller typically handles 30 to 50 claims per full working day, according to billing operations benchmarks discussed across industry forums. If EOB data entry consumes 5 to 8 minutes per document, even 30 EOBs eats up 2.5 to 4 hours—half the working day. The other half goes to everything else: the follow-up, the rework, the phone calls. Every hour spent typing data from a PDF into a PM system is an hour not spent on the higher-value tasks that actually determine collection rates: denial analysis, underpayment recovery, and payer contract reconciliation.
This is the opportunity cost that most billing company P&Ls do not track. It is not a separate line item on the income statement, but it shows up indirectly in the aggregate: lower clean claim rates, higher days in A/R, and a collection percentage that never quite breaks 95 percent. A biller buried in data entry is not analyzing denial patterns.
The metric to watch: If your billers spend more than 40 percent of their day on data entry, your per-claim labor cost is structurally too high—and your collection rate is structurally too low. The two move together.
The technology stack you already pay for — and why it still leaves EOBs on your desk
Small billing companies do not operate in a technology vacuum. Most run on a practice management platform—Tebra, AdvancedMD, CollaborateMD (a Waystar company), or a similar system—connected to a clearinghouse like Waystar or Availity. These platforms handle claim creation, claim scrubbing, electronic submission via the HIPAA 837 transaction, electronic remittance advice auto-posting via the 835 ERA transaction, and denial tracking. They are sophisticated, expensive, and essential.
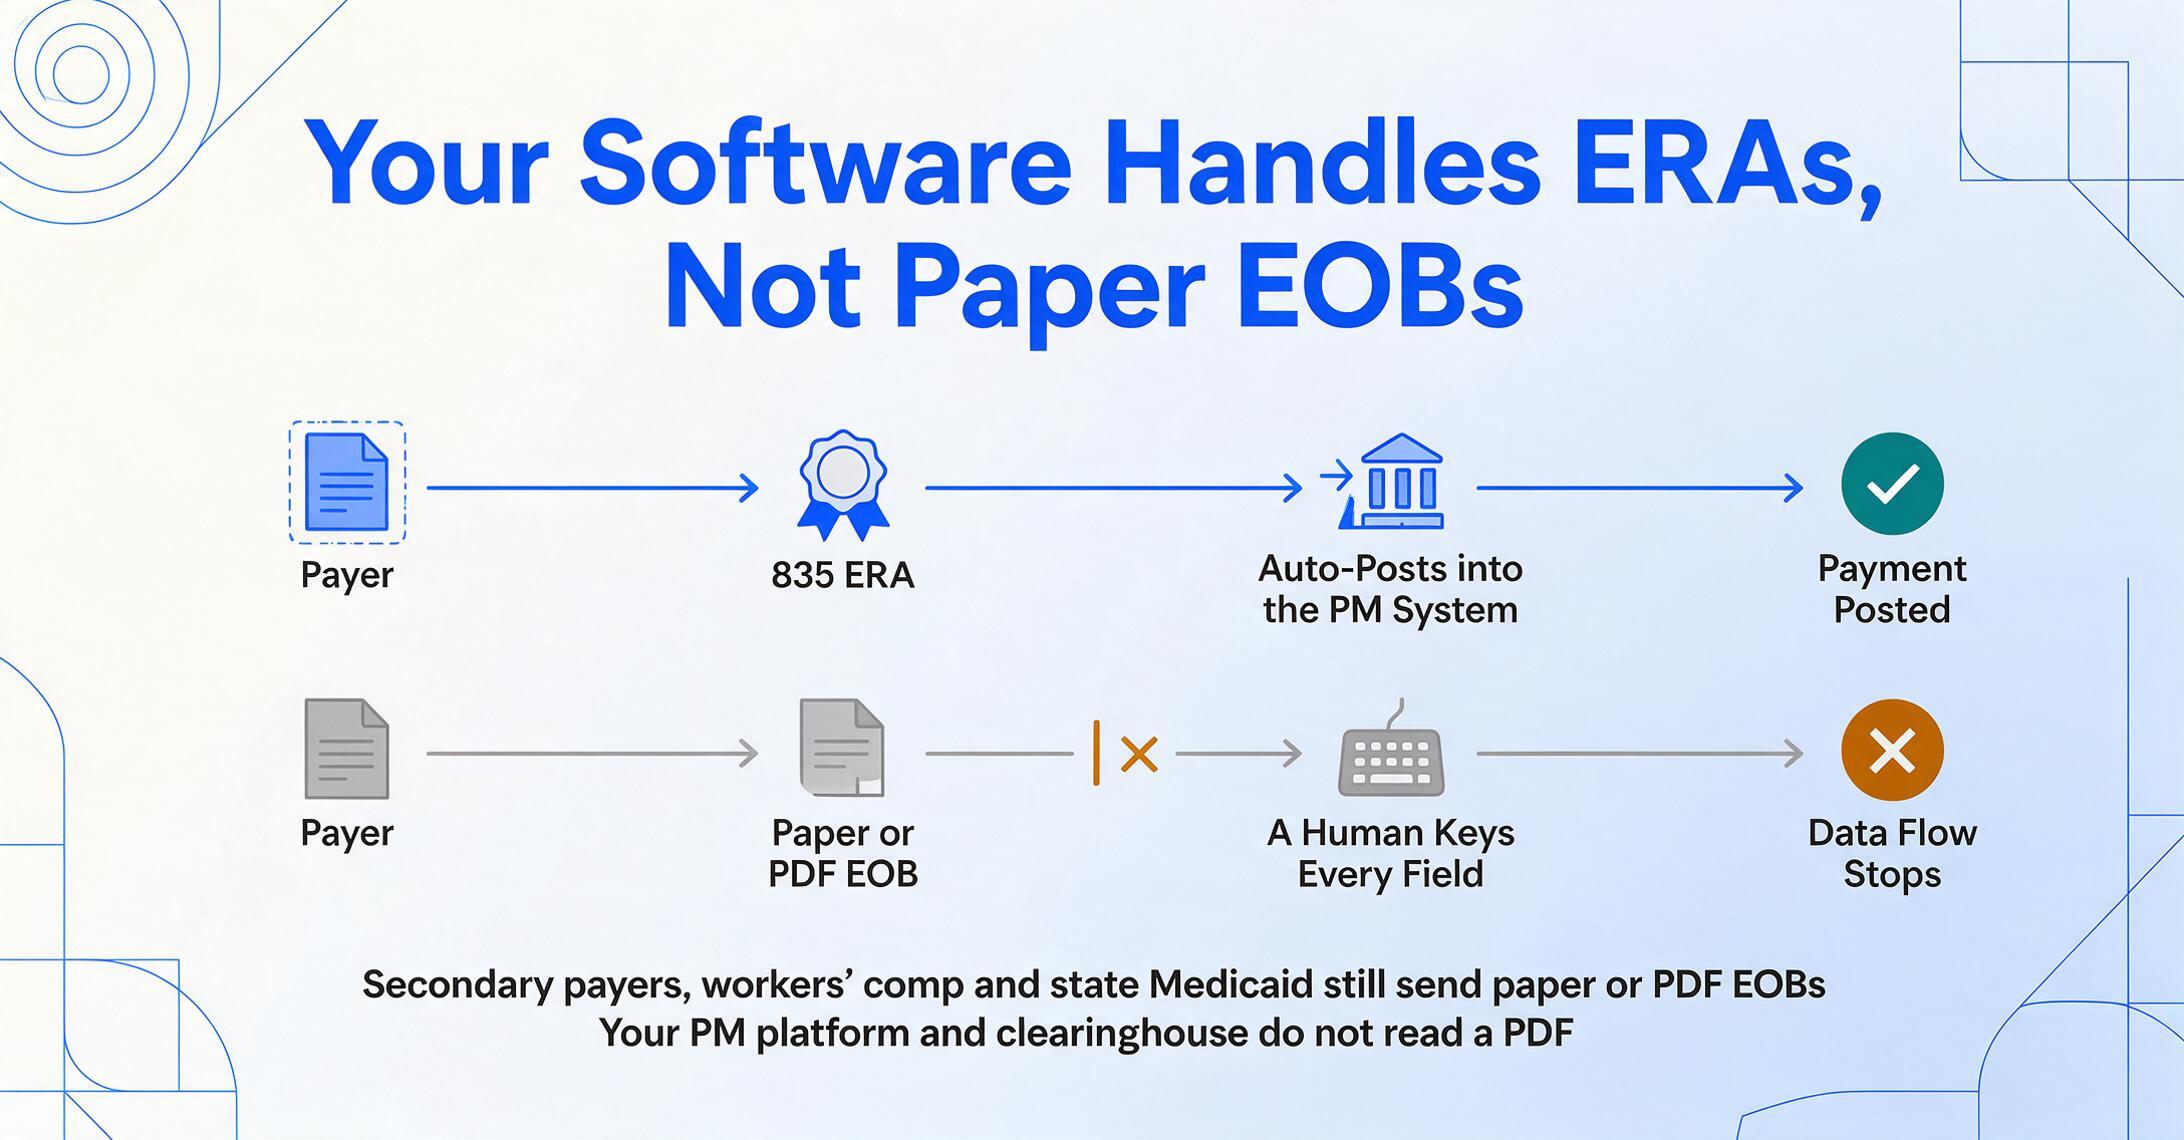
None of them extract data from a PDF or paper EOB.
This is the distinction that most automation discussions miss. When a payer sends a paper EOB—or a PDF downloaded from a payer portal—your PM system cannot read it. The ERA (Electronic Remittance Advice, the ASC X12 835 transaction that is the machine-readable counterpart to a paper EOB) can auto-post payments into the PM system, but only from payers with which you have an active electronic enrollment. Secondary payers, workers' compensation carriers, auto insurance, and many state-specific Medicaid programs still send paper or PDF EOBs. For these, the data flow stops at the inbox. A human has to read the document, identify the relevant fields—claim number, patient name, date of service, billed amount, allowed amount, paid amount, adjustment codes, patient responsibility—and manually enter them into the PM system. The expensive software stack you pay for every month does not bridge this gap.
What bridges it is an extraction step: a tool that reads the EOB PDF, identifies each data point regardless of payer-specific layout, and outputs it in a structured format that can be reviewed and imported. This is the step that separates automated workflows from manual ones. Batch extraction changes the economics further—instead of processing EOBs one at a time, you upload a folder of PDFs from multiple payers and extract all of them in a single pass. We covered that workflow end-to-end in our guide to batch EOB data extraction for billing teams, and our complete guide to EOB data extraction covers tool selection criteria in more depth if you're still evaluating options.
Errors — the cost multiplier you did not budget for
Denial rates have been climbing for a decade. The 2025 national average crossed 12.4 percent, up from roughly 8 percent in 2016, driven by increasingly aggressive utilization management and pre-authorization requirements from payers. A March 2024 MGMA poll reported that 60 percent of medical groups saw higher denials compared to the prior year. Each denied claim that must be researched, corrected, and resubmitted costs $25 to $50 in staff time. Complex appeals requiring clinical documentation and a written letter can exceed $100.
Manual EOB data entry feeds this cycle at two points. First, entry errors—a mistyped adjustment code, a patient responsibility amount posted to the wrong line, a write-off applied where a denial code should have been—create claims that fail reconciliation and require rework. Second, when billers are moving fast through a stack of EOBs to meet volume targets, underpayments go unnoticed. A payer applies the wrong contracted rate; a contractual adjustment is coded as patient responsibility; a secondary insurance balance is written off instead of billed. MGMA data shows that practices accept underpayments on 7 to 15 percent of paid claims without appealing them. For a small billing company, this is not a theoretical concern. A 7 percent underpayment rate on $1.5 million in annual collections is $105,000 walking out the door.
The error cost cannot be eliminated by hiring more billers or paying overtime. It is a function of the manual step itself—the human eye reading a dense, multi-section payer document and relaying it to a keyboard. The fix is removing the transcription step, not adding more transcribers.
Underpayment recovery alone can fund automation. Reducing the unappealed underpayment rate from 7 percent to 3 percent on a $1.5M book of business recovers $60,000 per year—often more than the annual cost of extraction tools and the staff time they replace.
What changes when EOB data extraction is automated
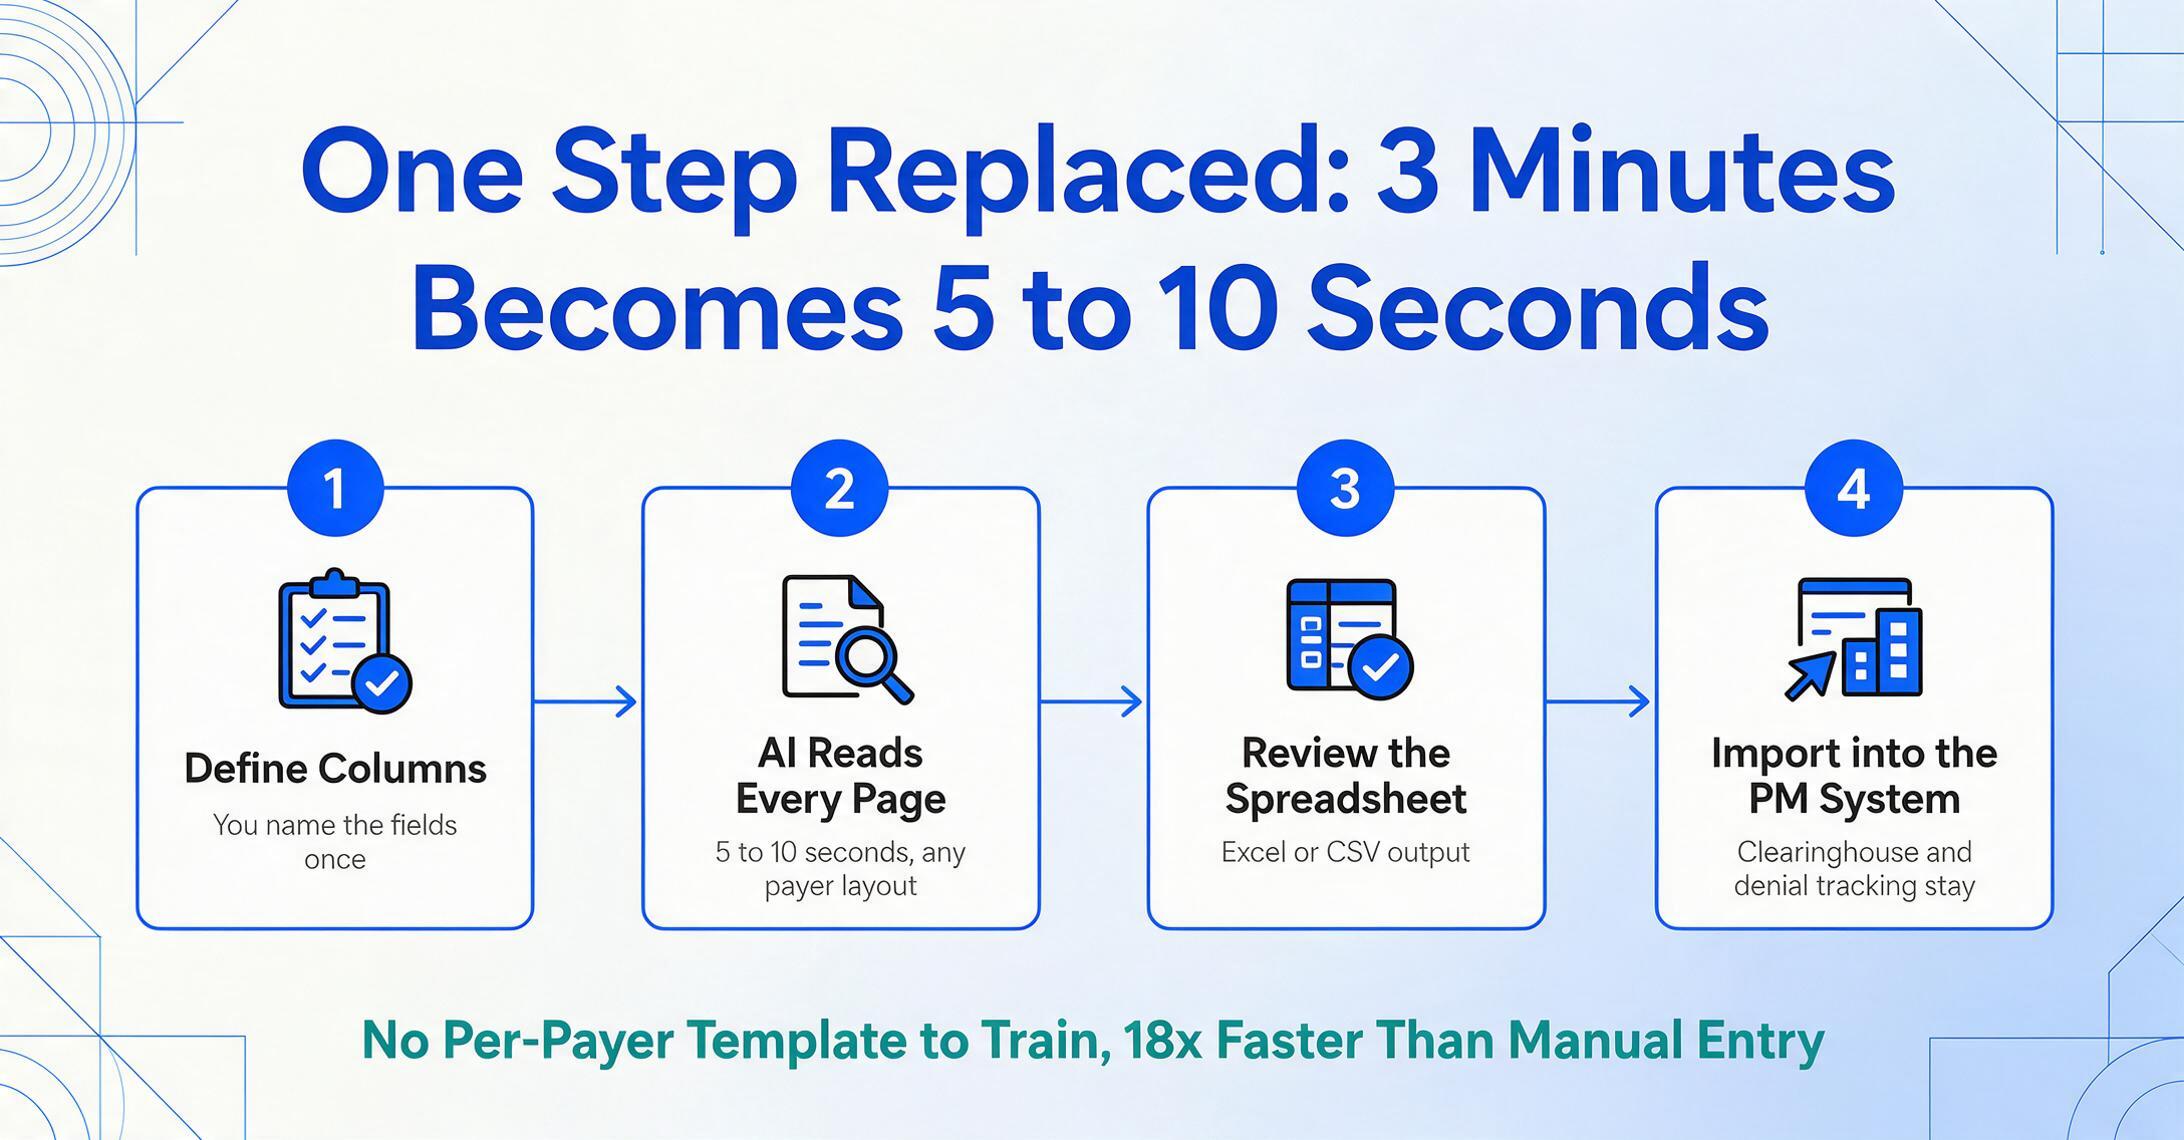
An extraction tool does not replace the PM system, the clearinghouse, or the biller. It replaces one step: the manual keyboard entry of data from a PDF into the system. Everything else—claim creation, electronic submission, denial tracking, provider credentialing—stays in place. The cost model shifts at the extraction step only, which is precisely where the bulk of the per-EOB labor cost lives.
ImageToTable.ai uses what is called column-name extraction: you define the data fields you want—"Claim Number," "Patient Name," "Date of Service," "Billed Amount," "Allowed Amount," "Paid Amount," "Adjustment Codes," "Patient Responsibility"—and the AI reads each EOB page to locate those values, regardless of payer layout. No template needs to be trained per payer. No coordinate-based box-drawing. The same column-name configuration works across Blue Cross, Aetna, Medicare, workers' comp, and any other payer format. The tool processes a single page in 5 to 10 seconds, compared to an average of 3 minutes for manual entry—an 18x speed difference. Output is delivered as an Excel spreadsheet or CSV file, which can be reviewed before importing into the PM system.
Files are processed securely and not stored.
The per-claim economics shift as follows. The tool processes each EOB page in seconds rather than minutes, which means the biller's time shifts from data entry to data review—skimming the extracted spreadsheet for anomalies rather than typing every field. At an estimated 1 to 2 minutes of review time per EOB instead of 5 to 8 minutes of entry time, the labor cost per EOB drops from $2.75–$4.65 to roughly $0.55–$1.25. The technology overhead stays roughly the same (PM software and clearinghouse fees are unchanged), but the error cost line shrinks: when data is machine-extracted rather than manually typed, transcription errors—the most common source of misposted adjustments and incorrect write-offs—decline significantly.
The result is a net per-EOB cost in the range of $1.15 to $2.05, including tool subscription, reduced review time, and the same technology stack. At 500 EOBs per month, the savings run approximately $1,000 to $1,500 per month—$12,000 to $18,000 per year. For billing companies using the tool in batch mode across multiple payer formats, the per-claim cost drops further as the volume absorbs the fixed tool cost and the review step benefits from consistency across all EOBs in a batch.
Building your own per-EOB cost model
The numbers above are built on national medians and industry benchmarks. To calculate your own company's number, you need four inputs:
- Your biller's fully burdened hourly cost. Take base salary, add 25 to 30 percent for benefits, payroll taxes, and PTO. Divide by approximately 1,800 productive hours per year. This is your true labor rate.
- Your average minutes per EOB. Time your billers on a representative sample across different payers. Most small billing companies that measure this find between 5 and 8 minutes when including payer portal login and claim lookup time.
- Your monthly EOB volume. Count only paper and PDF EOBs—not ERAs that already auto-post. This is the volume that actually requires manual entry.
- Your denial rate attributable to posting errors. Run a denial reason report from your PM system. Flag denials where the root cause was incorrect data entry rather than coding or authorization issues. This is the portion your extraction tool directly addresses.
Multiply (1) by (2) to get your per-EOB labor cost. Multiply that by (3) for your monthly labor spend on EOB entry. Estimate error cost at roughly 5 percent of your labor cost for conservative planning, or use (4) for a more precise figure. Compare the total to the cost of an extraction tool plus the reduced review time.
The payback threshold for most small billing companies sits around 300 to 400 paper EOBs per month. Below that volume, the labor cost is manageable with existing staff. Above it, the gap between what you are paying for manual entry and what extraction costs widens fast—and the extra biller hours freed up shift to the revenue-protecting work that directly improves collection rates.
Rule of thumb: If your annual EOB data entry labor cost exceeds the cost of hiring a full-time biller (roughly $60,000 to $68,000 fully burdened), you are past the point where manual entry makes financial sense. At the 5-minute-per-EOB benchmark, that threshold is approximately 1,100 EOBs per month.
Frequently Asked Questions
Does automated EOB extraction work with handwritten or scanned EOBs?
Yes. ImageToTable.ai's vision model reads scanned documents and handwritten text the same way it reads typed PDFs—by understanding what is on the page, not by matching pixel coordinates to a template. Handwritten adjustment notes or circled denial codes on a scanned EOB are handled identically to printed fields. There is no accuracy penalty for non-digital originals.
Does the tool handle multi-page EOBs with dozens of line items?
Yes. Multi-page EOBs with large procedure code tables—common in hospital or surgical billing—are processed in the same extraction pass. The output spreadsheet captures every line item across all pages, organized by claim. For very high-volume EOBs (100+ line items), the processing time scales proportionally but remains well under a minute per document.
What happens when a payer changes its EOB layout?
Nothing needs to change on your end. Because the extraction is column-name based rather than template-based, the AI reads "Allowed Amount" wherever it appears on the page, regardless of layout changes, column reordering, or font updates. You do not need to rebuild extraction rules when a payer redesigns their form.
Can the extracted data import directly into our practice management system?
The tool outputs Excel (XLSX) and CSV formats, which can be reviewed and then imported into most PM systems that support batch payment posting or bulk data import. Direct API integration with specific PM platforms is not a current feature, so the workflow typically involves review of the extracted spreadsheet followed by import, rather than a fully automated end-to-end posting. The time saved is in the extraction and data structuring step—the review and import are intentional quality-control checkpoints.
Is this only for billing companies, or can individual practices use it too?
The tool works identically for both. A solo practice receiving 60 paper EOBs per month from secondary payers benefits from the same extraction workflow as a billing company handling 600. The difference is in volume-driven cost justification—below roughly 300 EOBs per month, the savings are real but smaller in absolute terms.
Does ImageToTable.ai integrate with Google Sheets?
Yes. A Google Sheets sidebar add-on lets you upload EOB PDFs directly from within Google Sheets, specify your extraction columns, and have structured data appended to your spreadsheet without switching between applications. This is an additional workflow option available with an API key.
The hardest number to calculate in a billing company's P&L is the cost of something that should not be happening. Manual EOB data entry falls into that category—it is a task that exists because the technology gap between what payers send and what PM systems can read has been filled by human labor for decades. That gap is now bridgeable, and the math on whether to bridge it is simpler than most billing company owners assume. You do not need a consultant or a cost study. You need your hourly labor rate, your minutes per EOB, and your monthly volume. Everything else is arithmetic.