Every Supplier Invoice Knows Your
Food Cost. Why Don't You?
A Sysco invoice arrives for $2,847. Sixty-seven line items across proteins, produce, dairy, and dry goods. The chef knows his target food cost is 30% — but that number is a monthly aggregate. It does not tell him that Chilean salmon at $14.80/lb consumed 19% of this week's total spend, or that dairy prices crept up 7% from the same week last month. Those insights exist inside the invoice. They sit there, printed in columns and rows that no human will type into a spreadsheet at 11 p.m. on a Saturday. Not because the chef lacks discipline. Because the friction is structural: the food cost percentage you need is trapped in documents designed to be read by the person who signs the check, not the person who needs the numbers.
The Food Cost Formula Is Easy. The Data Is the Quiet Crisis.
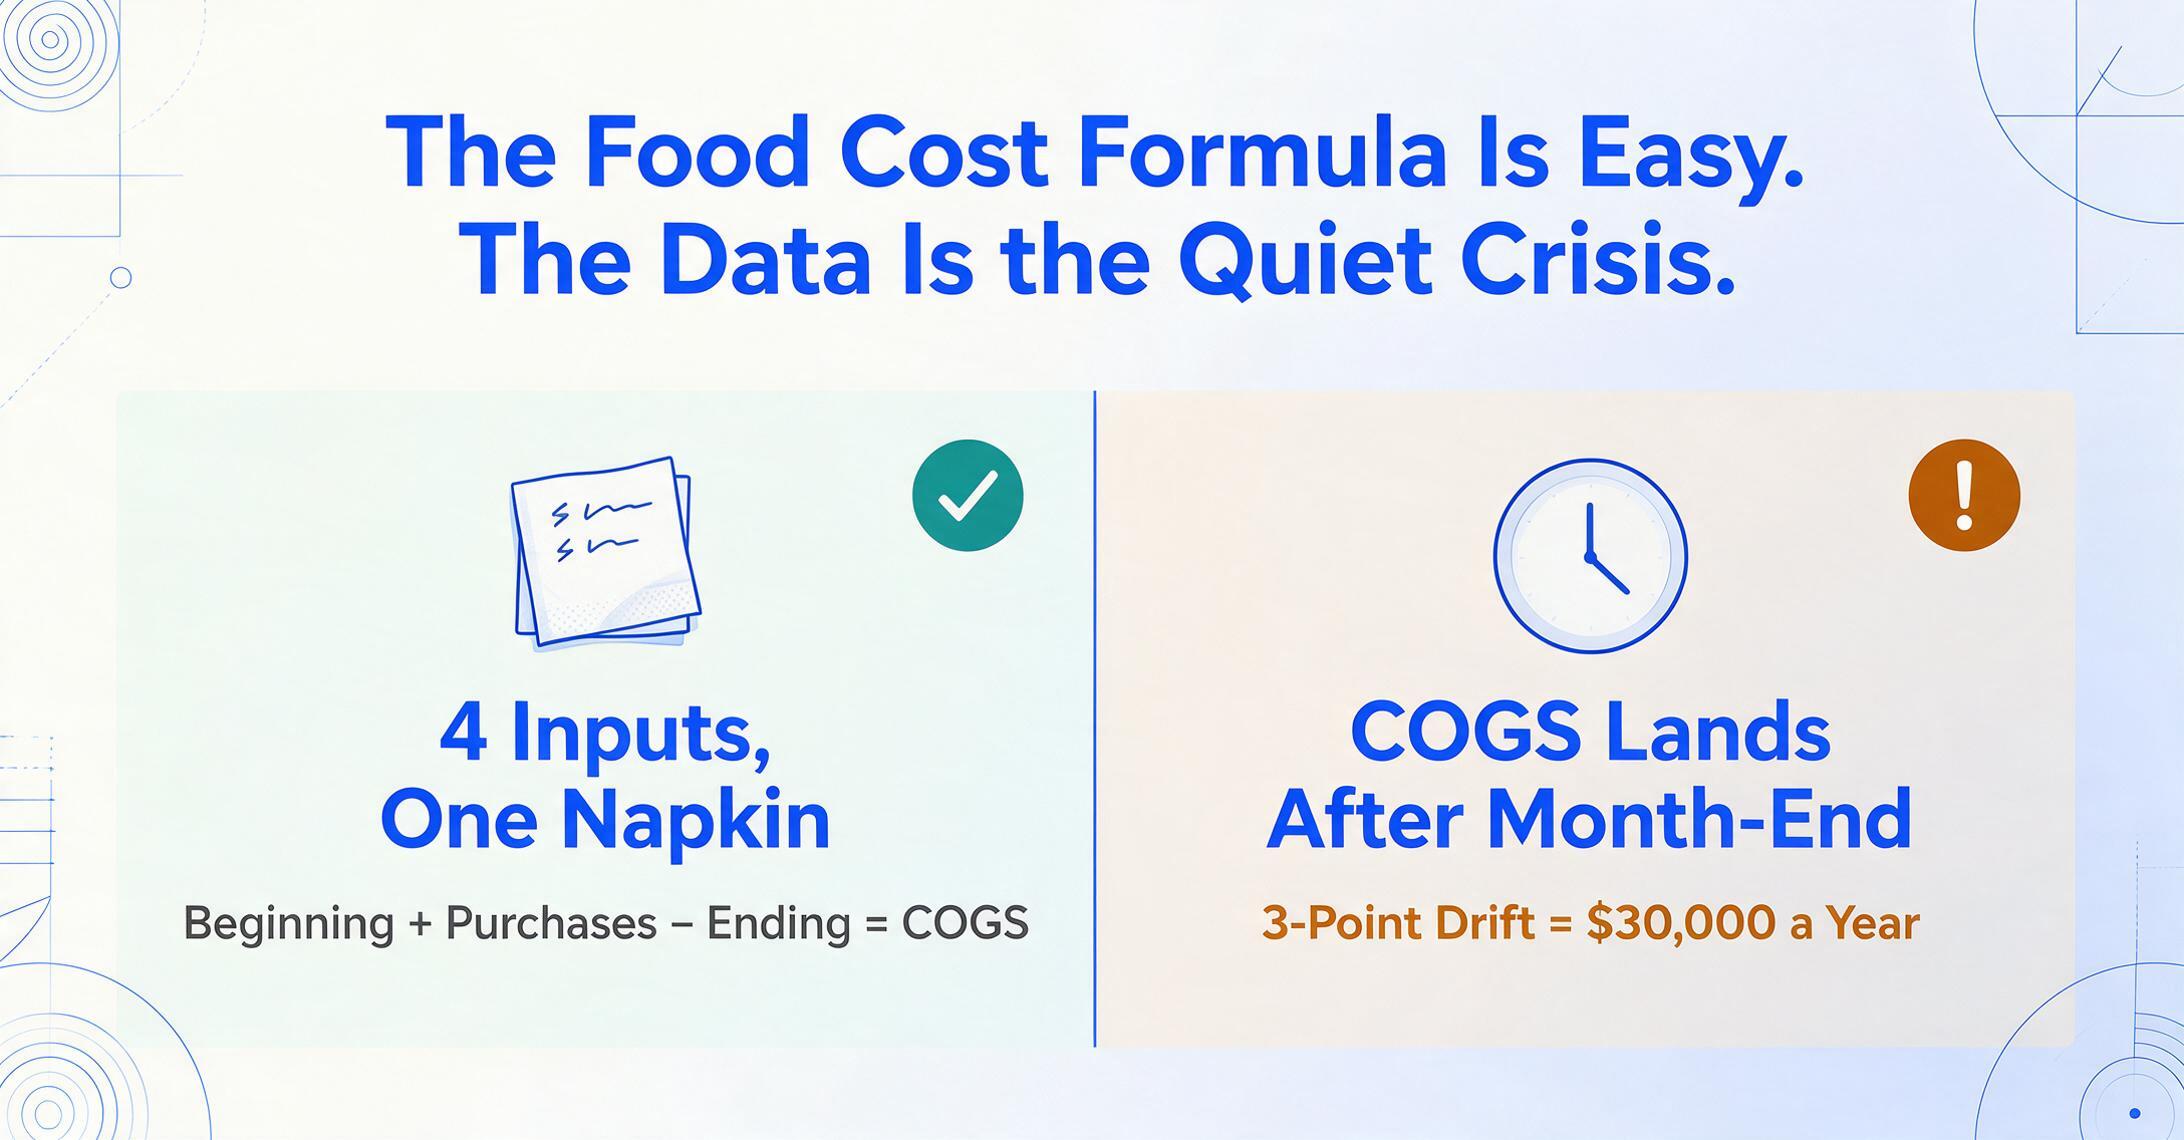
The food cost percentage formula has exactly four inputs: Beginning Inventory + Purchases − Ending Inventory = Cost of Goods Sold. COGS ÷ Food Sales × 100 = food cost percentage. If your COGS is $32,000 and food sales are $100,000, your food cost is 32%. The math fits on a napkin.
The industry benchmark sits between 28% and 35% of revenue — consistent across decades of restaurant financial data. Full-service restaurants target the lower end of that range. Quick-service models often run a few points higher on ingredients but lower on labor, keeping prime cost — food plus labor, the number that actually determines profitability — near the critical 60% threshold. The National Restaurant Association's 2026 State of the Industry report delivered a sharper data point: food costs are now more than 35% above pre-pandemic levels, and only 42% of U.S. restaurants were profitable in 2024.
But the formula is not the bottleneck. The bottleneck is the distance between when an invoice arrives and when its data becomes usable. A restaurant operator running $1 million in annual food sales who drifts 3 percentage points above target — from 30% to 33% — is losing $30,000 per year. That gap exists not because the operator does not know the formula. It exists because the COGS number, assembled invoice by invoice, arrives too late to act on. By the time the month closes and the P&L arrives, week one's over-ordering is ancient history.
A 3-percentage-point food cost drift on $1 million in food sales is $30,000 in lost profit — and that number never appears on any P&L line because the detection system, real-time invoice-level costing, is the very thing operators have been told they cannot have.
What a Single Supplier Invoice Can Tell You — If You Stop Typing
Most operators process invoices in one of two ways: they either type line items into a spreadsheet manually, or they do not process them at all and let the accounting software capture the invoice total. Both approaches miss the same thing: line-item-level cost intelligence.
A single US Foods invoice does not just say "you owe $2,847." It says: your salmon spend this week is $562, or 19.7% of total purchases. Your dairy line is $418, or 14.7%. Your produce — $387 on Roma tomatoes, heirloom carrots, and mixed greens — is 13.6% of this week's order. None of these numbers are printed on the invoice as percentages. They are latent. Waiting to be computed. But to compute them, someone has to type each of those 67 line items into a spreadsheet first.
On Reddit, in threads where operators trade food cost tracking methods, the answer is consistently the same: manual entry into Excel. "I manually enter them into Excel for my own records, and my accountant tracks them in our P&L using my bank statements," wrote one owner. Another thread in r/KitchenConfidential shows cooks and chefs debating the basic arithmetic: opening inventory plus purchases minus closing inventory, divided by sales. They know the math. What they do not have is zero-friction access to the raw data.
The gap between the formula you understand and the data you can actually use is not a knowledge gap. It is a data-logistics gap. Solving it does not require better training. It requires removing the typing step between the invoice and the spreadsheet.
Computed Columns: The Feature That Calculates Food Cost Percentage From a Photo
This is where the capability that changes the workflow sits. ImageToTable.ai offers computed columns — columns whose values are not extracted from the document but calculated by AI during extraction, using the data it just read. The AI reads the invoice, extracts each line item's description, quantity, unit price, and line total, and then — in the same pass — performs the arithmetic and outputs the result as a new column in the spreadsheet.
Here is what that means for food cost tracking. You photograph a supplier invoice. You define these columns:
| Column Name | Type | What It Produces |
|---|---|---|
Item Description | Direct Extraction | "Atlantic Salmon Fillet 8oz" |
Unit Price | Direct Extraction | 14.80 |
Line Total | Direct Extraction | 562.40 |
Cost % of Invoice (Line Total ÷ Invoice Total × 100) | Computed | 19.7% |
Cost Per Unit (Line Total ÷ Qty) | Computed | $14.80/lb |
Target Menu Price (Cost Per Unit ÷ 0.30) | Computed (fixed parameter: 30% target food cost) | $49.33 per portion |
Category (options: Protein/Dairy/Produce/Dry Goods/Beverage) | Inferred | "Protein" |
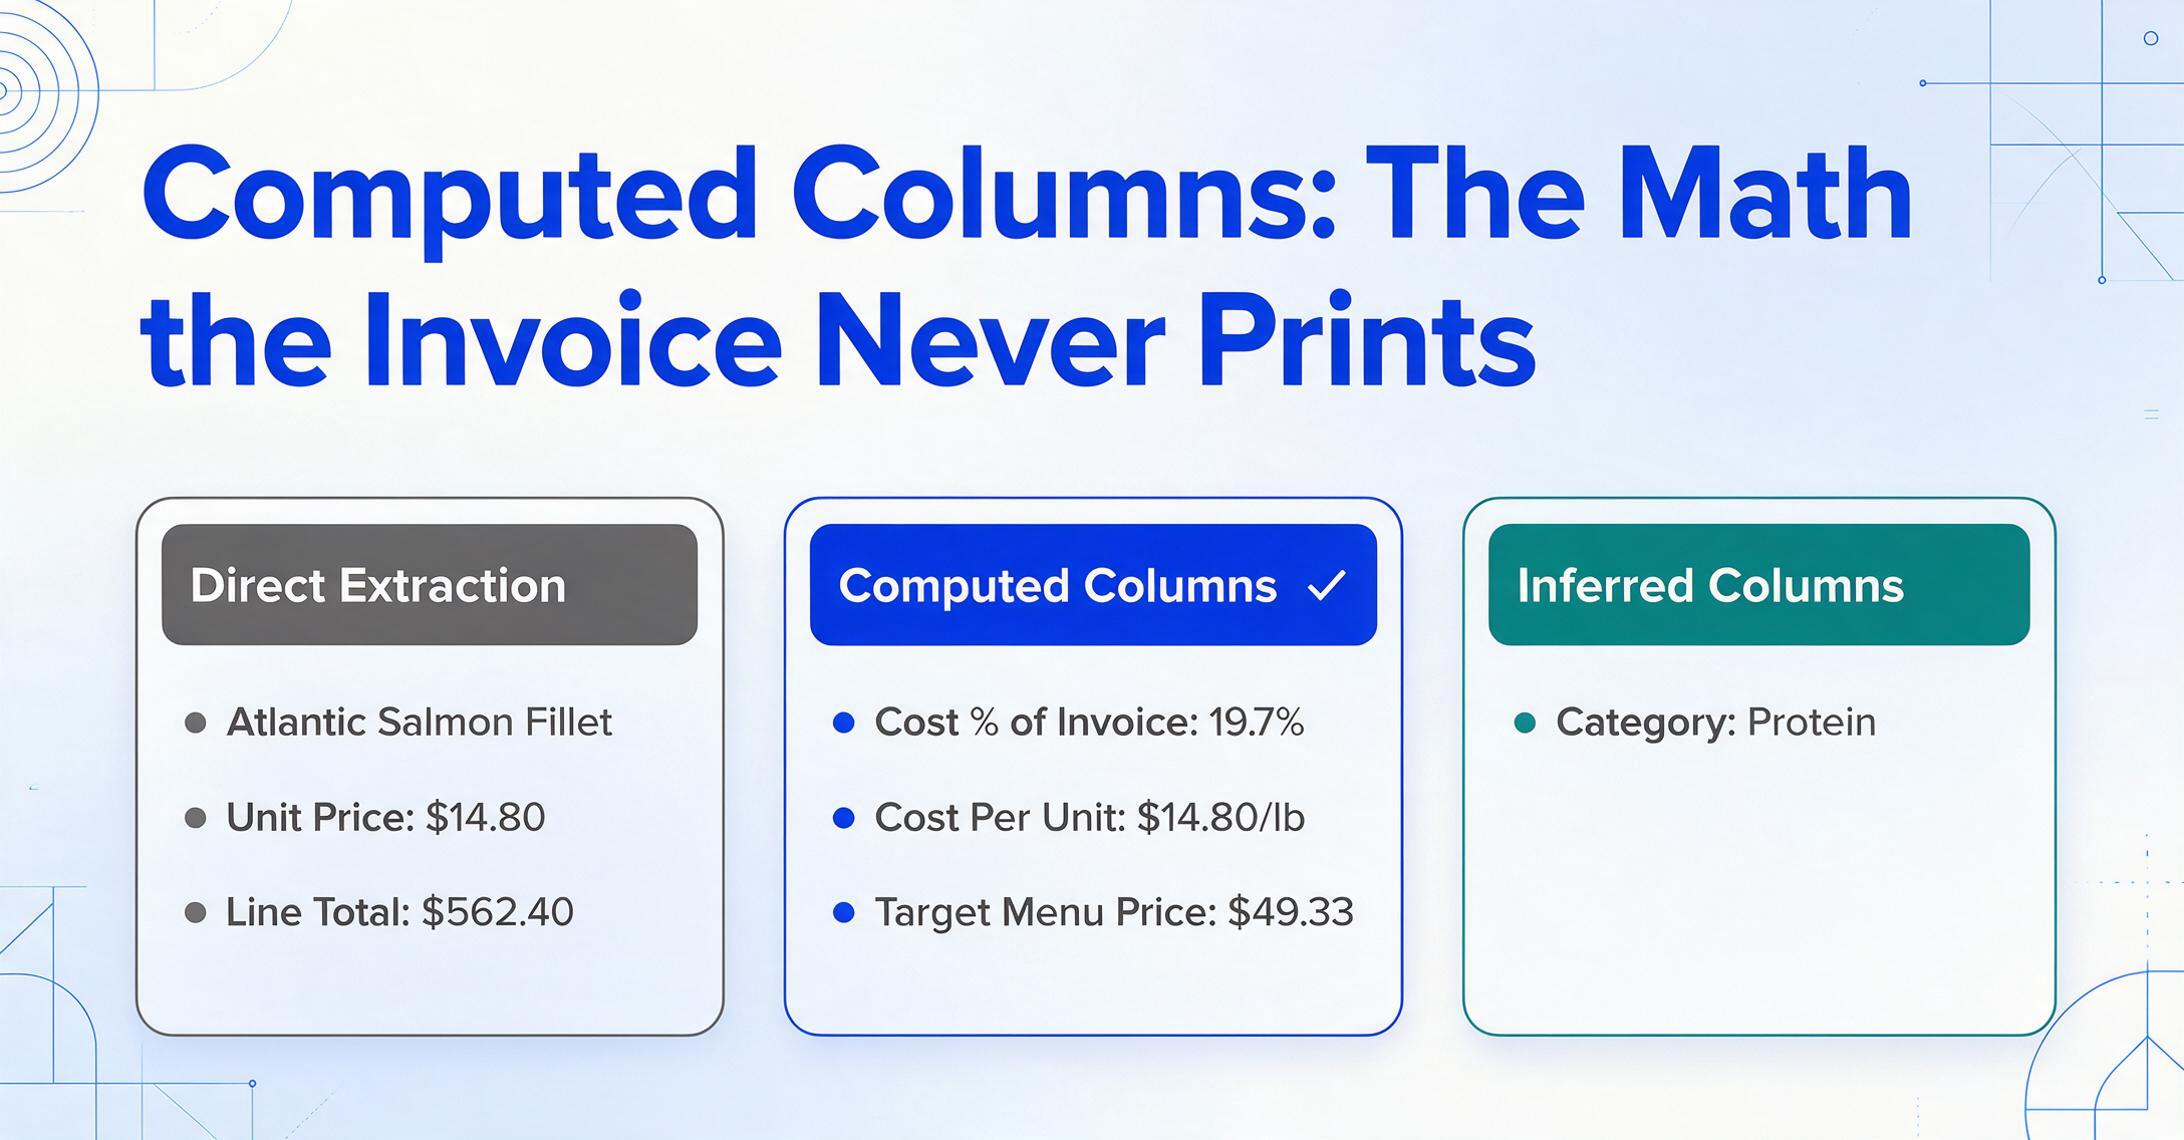
The first three columns are direct extraction — the AI finds the values printed on the invoice. The next three are computed columns: the AI performs the calculation during extraction and writes the result. The final column is an inferred column — the AI reads the item description, understands the product category from context, and fills in the appropriate label without you needing to classify anything manually.
The cost-percentage column is the immediate win. You photograph the invoice, and the spreadsheet tells you salmon cost 19.7% of this week's purchases — the number that would have required typing 67 lines and writing a formula to get. The Target Menu Price column goes one step further: using a fixed target food cost of 30% (which you embed directly in the column definition — it does not need to appear on the invoice), the AI computes what you need to charge per portion for that ingredient to land at your margin. A pound of salmon at $14.80 with a 30% food cost target requires a menu price of $49.33 per pound-equivalent portion. That is not a number you look up. It is a number the AI derives.
None of this requires you to create a template for each supplier. Unlike template-based tools that require you to define parsing rules per vendor layout — one rule set for Sysco, another for US Foods, another for the local produce distributor — ImageToTable.ai reads the invoice by understanding what each piece of data means. When Sysco changes its invoice layout next quarter, nothing breaks. The AI is matching on semantic meaning, not position.
A single photo of a supplier invoice can now produce a spreadsheet row where the cost percentage, cost per unit, target price, and product category are all calculated automatically — in 10 seconds, without a single keystroke of manual data entry.
The 10-Second Workflow: From Invoice Photo to Cost Breakdown
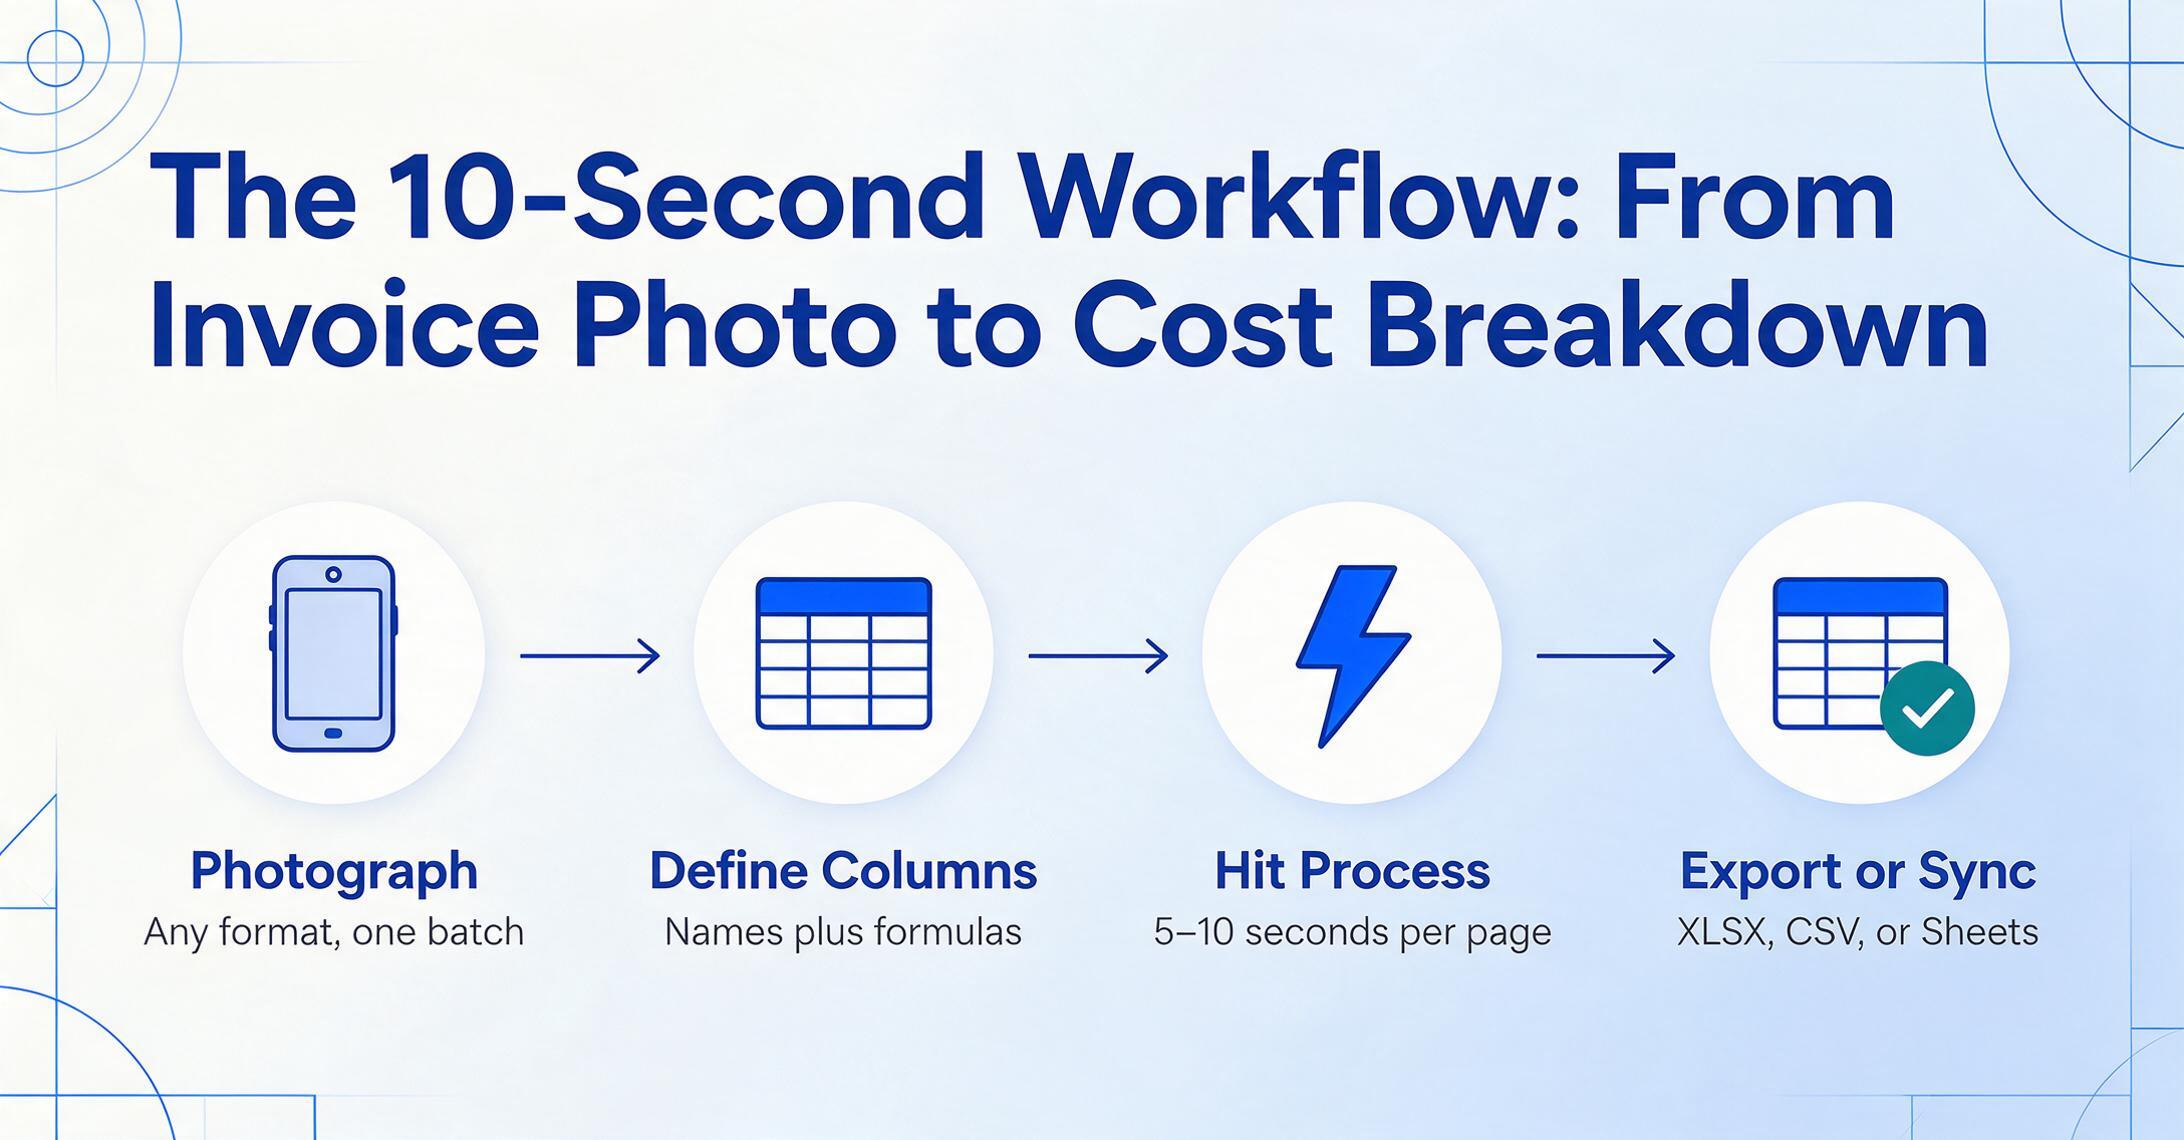
The entire process fits into four steps. No software to install. No integration to configure. No template to build.
Step 1
Photograph or upload your supplier invoices. A photo taken on a phone camera works — you do not need a scanner. JPG, PNG, or PDF are all accepted. If you received a full week's worth of invoices, upload them all at once as a batch.
Step 2
Define your columns. Type the column names you want as output — including computed columns with the calculation logic written directly into the column name, like Cost % of Invoice (Line Total ÷ Invoice Total × 100). This is called Custom Column Extraction: you define the output you want, and the AI locates the corresponding data anywhere on the invoice by understanding what it means, not where it sits.
Step 3
Hit process. The AI reads each invoice, extracts the data, performs the computations, and assembles everything. Processing takes 5–10 seconds per page — roughly 18× faster than manual entry.
Step 4
Export or sync. Download as Excel (XLSX) or CSV. If you use Google Sheets, the Sheets Add-on places the extracted data directly into your active spreadsheet — no export-and-import step needed. Each row contains all extracted fields plus computed values: item description, unit price, line total, cost percentage of invoice, cost per unit, target menu price, and category.
For a typical restaurant receiving 8–12 supplier invoices per week, the cumulative time saving is 2–3 hours — every week. But the larger value is not the time. It is that you now have line-item cost percentages available on Tuesday, after Monday's deliveries, rather than three weeks later when the month-end P&L arrives. That is when the number becomes actionable: you see salmon at 19.7% of the week's spend and decide whether to adjust the next order, renegotiate with the supplier, or rework the menu.
Frequently Asked Questions
Can I calculate food cost percentage directly from supplier invoice photos?
Yes — using computed columns, the AI extracts each line item's total and the invoice grand total, then calculates (Line Total ÷ Invoice Total) × 100 as a new column. The result appears in your spreadsheet alongside the raw extracted data. No manual formula entry in Excel required.
Does this work if my supplier invoice is handwritten?
Yes. The underlying AI model reads both printed text and handwriting, including cursive — common on invoices from smaller local suppliers who still issue paper slips. Recognition accuracy varies with handwriting legibility, but standard handwritten invoices from food distributors are well within the model's capability.
What if I have invoices from 10 different suppliers, all with different formats?
Format does not matter. This is the core advantage over template-based tools: ImageToTable.ai does not need a parsing template per supplier. It reads each invoice by understanding what the data means (a dollar amount next to a product description is a line item; the largest number at the bottom is the total), not where it sits on the page. Sysco, US Foods, Gordon Food Service, and local distributors can all be processed together in the same batch with no per-vendor configuration.
Can I include my menu prices to calculate profit per item?
Yes. You can define a computed column like Margin (Menu Price − Line Total) or Markup % ((Menu Price − Line Total) ÷ Line Total × 100). If your menu prices are constant, embed them as fixed parameters in the column definition. If they vary by item, use a separate reference table — the AI reads the ingredient and pulls the corresponding menu price during computation. If those prices live only on a photographed menu, converting a menu photo to table rows first gives the AI a reference table to compute against.
What does this cost?
ImageToTable.ai has a free tier that lets you test with sample invoices. Paid plans start at $9/month (Basic), with $19/month (Pro) and $59/month (Max) for higher volume. Each plan includes a monthly allocation of processing credits. The free tier is enough to see whether the workflow fits your operation before committing.
Does this integrate with my accounting software?
The output is a standard Excel (XLSX) or CSV file — formats that import into any accounting platform, including QuickBooks, Xero, Restaurant365, and generic spreadsheet workflows. There is no native ERP integration, so you export the file and import it into your system. The Google Sheets Add-on eliminates this step if your workflow uses Sheets as the destination.
Files are processed securely and not stored.
The food cost percentage you need is not missing. It is waiting inside every supplier invoice — and now you can read it without typing a single number. Test it on your own invoices and find out whether your weekly food cost insight goes from 3 hours to 10 seconds.